Hedera Price Prediction: Can HBAR Finally Start Its Next Big Chapter?


There is a small detail buried in how Hedera charges for network usage that most price charts will never show you, and it happens to be relevant right now. Hedera bills its network fees in dollars, not in $HBAR, which means every time the token gets more expensive, transactions on the network quietly get cheaper in $HBAR terms.
That detail lands at an interesting moment, with $HBAR just having forced its way out of a downtrend that had held for weeks.
This Hedera price prediction pulls that fee mechanic together with the chart, the order flow, and the open interest data to see where $HBAR stands.
A Fee System That Gets Cheaper as HBAR Gets Pricier
A recent report from BSCN walked through the mechanics of that fee system. Hedera fixes the dollar cost of each network operation and keeps an on-chain file that tracks the current exchange rate, refreshing it roughly every hour so nodes always know how much HBAR a given dollar fee requires.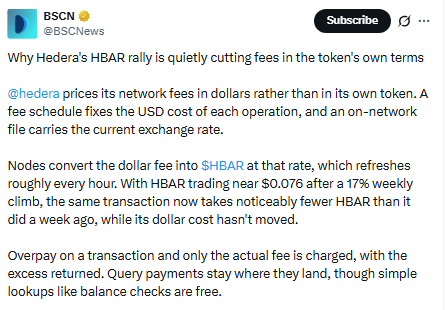
When HBAR price rises, as it has this week, that same fixed-dollar operation costs fewer tokens than it did before, and any accidental overpayment gets returned automatically.
It is a quiet, unglamorous mechanic, but it means the network becomes more efficient in HBAR terms exactly when demand for the token is picking up, which is worth keeping in view alongside the technical picture below.
How Sellers Lost Their Grip on HBAR
According to the TradingView chart, sellers had controlled HBAR for weeks, pressing the price lower inside a channel that kept making new lows without much resistance.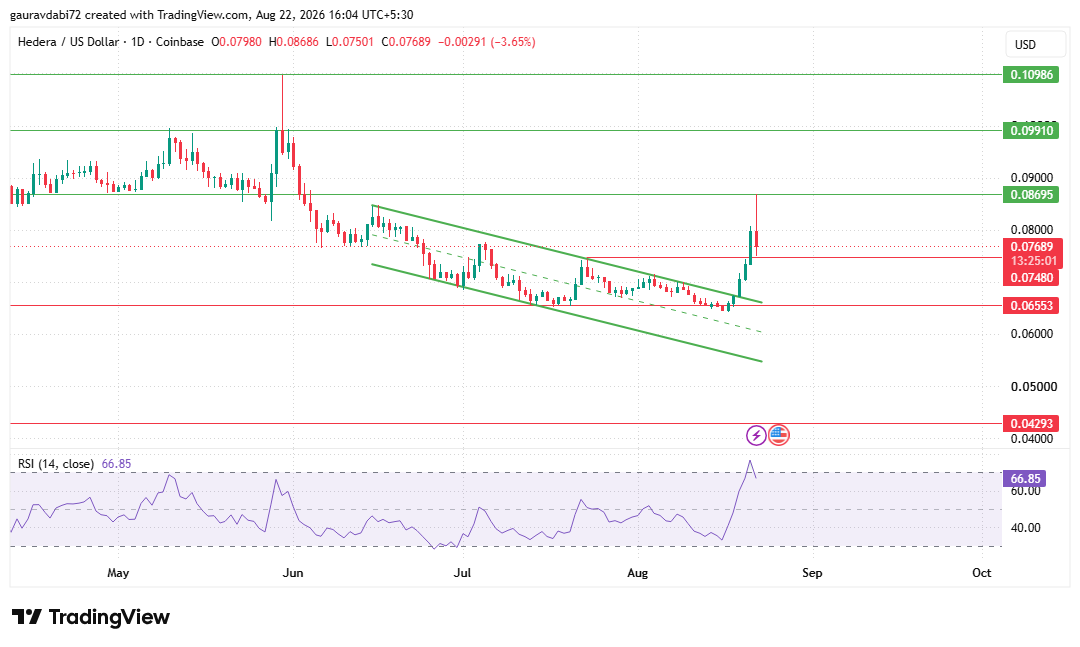
That grip broke on a single session, a green candle large enough to close above the channel's upper boundary and pull three straight days of buying behind it.
The advance carried the price to $0.08695 before stalling there, and it has been holding just under that level since.
Momentum backs up the move without being extreme about it: the 14-period RSI reads 66.85, comfortably bullish but with plenty of headroom before it would count as overbought.
Volume Tells a Bigger Story Than the Price Tag Does
According to CoinMarketCap data, HBAR itself is only up 0.88% over 24 hours to $0.07738, a modest gain, but trading volume jumped 112.3% to $243.12 million, lifting the volume to market cap ratio to 7.05%.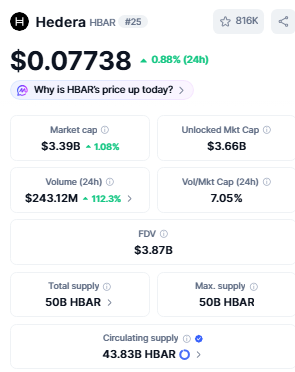
Market cap sits at $3.39 billion, up 1.08%, against an unlocked market cap of $3.66 billion and a fully diluted valuation of $3.87 billion. Supply is fixed at 50 billion HBAR total and max, with 43.83 billion HBAR already circulating.
What the Order Flow Says About This Move
Coinglass data shows a mixed picture zooming out across timeframes. The 7-day gain of 17.42% and 30-day gain of 6.16% look healthy, but 90-day (-13.85%), 180-day (-21.19%), year-to-date (-27.26%), 1-year (-67.19%), and all-time (-81.43%) numbers are all still negative, and the last 4 hours have pulled back 3.27% even with the 24-hour figure holding at +0.44%.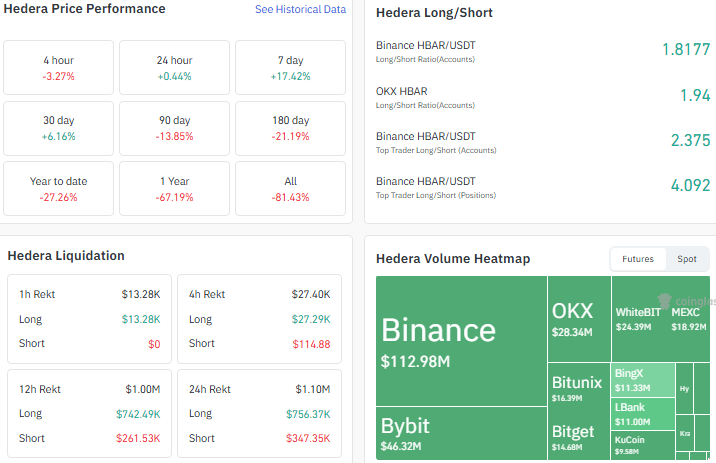
Traders are leaning long, with Binance's account ratio at 1.8177 and OKX at 1.94, while Binance's top traders are far more aggressive at 2.375 by accounts and 4.092 by positions.
Liquidations reached $1.10 million over 24 hours, dominated by longs at $756.37K against $347.35K in shorts.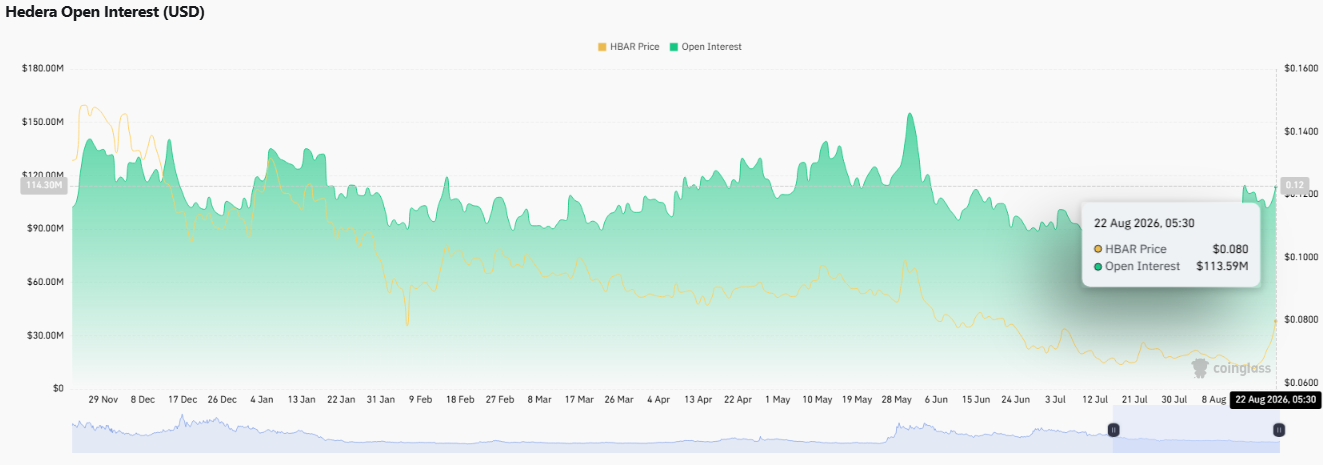
Open interest has climbed to $113.59 million alongside the breakout.
The Number That Decides What Happens Next
This HBAR price prediction starts with one number: $0.08695, the line in the sand right now.
A move through it puts $0.09910 in view, and beyond that $0.10986. The floor underneath this consolidation is $0.07480, and holding it keeps the setup intact.
A slip below that floor would put HBAR back in touch with $0.06553 and $0.04293 further down if selling pressure returns in force.
None of this changes as fast as headlines suggest, so this Hedera price prediction treats these as reference points rather than fixed outcomes.
A Test Still in Progress, Not a Reversal Confirmed
The CoinGabbar analyst reads this less as a reversal already confirmed and more as a test still in progress.
A channel breakout backed by rising volume and long-heavy derivatives positioning is not something to dismiss, and it does argue for near-term strength, but HBAR has broken resistance before during this longer downtrend without following through, so the analyst is watching whether $0.08695 actually gets cleared rather than assuming it will.
The token's deeply negative yearly and all-time numbers keep the bigger trend firmly bearish until proven otherwise, which is why this Hedera price prediction stops short of calling the downtrend over.
Three Ways This Could Play Out
Scenario | Trigger | Key Levels |
Bullish | $HBAR clears $0.08695 with conviction | $0.09910, then $0.10986 |
Neutral | Price holds the pause without losing $0.07480 | Range-bound between $0.07480 and $0.08695 |
Bearish | Break below $0.07480 | $0.06553 and $0.04293 back into focus |
This Hedera price prediction reflects the chart and derivatives data available at the time of writing and is not investment advice.
Disclaimer: This article is for informational purposes only and does not constitute financial, investment, or trading advice. Cryptocurrency markets are highly volatile and prices can change rapidly. Readers should conduct their own research and consult a qualified financial advisor before making any investment decisions.
Also read:












.webp)




