Hedera Price Prediction: HBAR Eyes an Explosive Move to $0.08500

This Hedera price prediction looks at a chart that has quietly turned interesting.
HBAR has spent the last month grinding lower along a well-defined descending trendline, but the character of the selling has shifted in recent candles, and a fresh burst of volume on the green candles is hard to ignore.
Traders watching HBAR right now are asking the same question: is this just another retest before the next leg down, or the start of something bigger?
This piece walks through exactly what the chart, the liquidation data, and the exchange volume spread are showing before naming any specific price target.
Hedera Price Right Now
Metric | Value |
Price | $0.06622 (CoinGlass: $0.06622, +1.78%) |
24h Futures Volume | $62.34M |
24h Spot Volume | $9.40M |
Market Cap | $2.89B |
Open Interest | $108.33M |
Circulating Supply | 43.83B HBAR |
Total Supply | 50.00 B HBAR |
Max Supply | 50.00 B HBAR |
Open interest near $108.33M against a $2.89B market cap shows leveraged positioning remains fairly modest relative to HBAR's overall size, which can mean less liquidation-driven volatility compared to smaller-cap tokens. Data as of Aug 17, 2026, 16:30 IST (11:00 UTC).
Chart source: Hedera Hashgraph/TetherUS Perpetual, 4H timeframe, Binance via TradingView, captured Aug 17, 2026, 16:30 IST.
Methodology and data sources: Price and volume data from CoinGlass, liquidation figures from CoinGlass, and exchange volume distribution from CoinGlass's Hedera volume heatmap.
HBAR Exchange Volume: Where the Activity Is Concentrated
Futures activity for HBAR is fairly well distributed across exchanges rather than concentrated in one venue.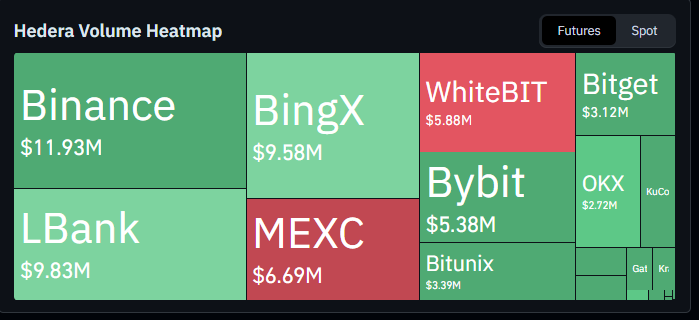
Binance leads with $11.93M, followed by LBank at $9.83M and BingX at $9.58M.
MEXC and WhiteBIT contribute $6.69M and $5.88M, respectively, while Bybit adds $5.38M, Bitunix $3.39M, Bitget $3.12M, and OKX $2.72M.
This spread across several mid-sized venues suggests the current price action isn't being driven disproportionately by any single exchange's order book. Source: CoinGlass volume heatmap, Aug 17, 2026.
HBAR Liquidation Data: A Shift Worth Watching
The liquidation pattern here has an interesting split by timeframe.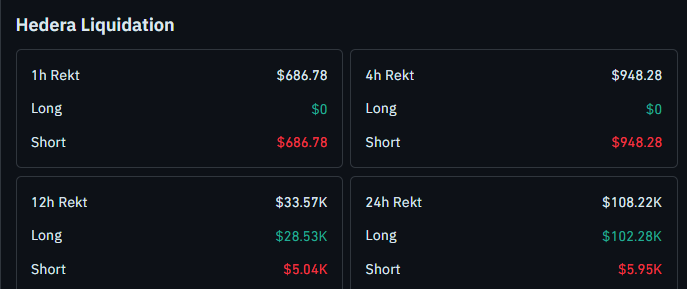
Over the last hour, $686.78 was liquidated entirely from short positions, and the 4-hour window shows a similar story with $948.28 in liquidations, all from shorts. That flips over longer windows.
The 12-hour figure shows $28.53K in long liquidations against just $5.04K in shorts, out of $33.57K total.
The 24-hour data confirms the same lean, with $102.28K in long liquidations compared to $5.95K in shorts, out of $108.22K rekt overall.
This suggests recent short-term bounces have squeezed shorts, while the broader trend over the past day has still been punishing longs positioned too early for a reversal.
Source: CoinGlass Liquidation data, Aug 17, 2026, 16:30 IST.
HBAR Trend and Momentum: Key Takeaways
HBAR trades at $0.06622, sitting right against its descending trendline after weeks of lower highs
Selling pressure into this retest has been notably slower and weaker than the prior two rejections at this same trendline
A sustained move near the trendline followed by an aggressive breakout and close above $0.06686 would open the door to a run through multiple resistance levels
A breakdown, with price rejecting the trendline and closing below $0.06529, shifts the picture bearish toward the next support
Long liquidations dominate the 12-hour and 24-hour windows, a shift from the short-heavy pattern seen in the 1-hour and 4-hour data
Binance leads exchange volume for HBAR at $11.93M, followed closely by LBank and BingX
Hedera Price Prediction: 4-Hour Chart Breakdown
HBAR has been retesting a descending trendline on the 4-hour chart, and each retest so far has resulted in a fall.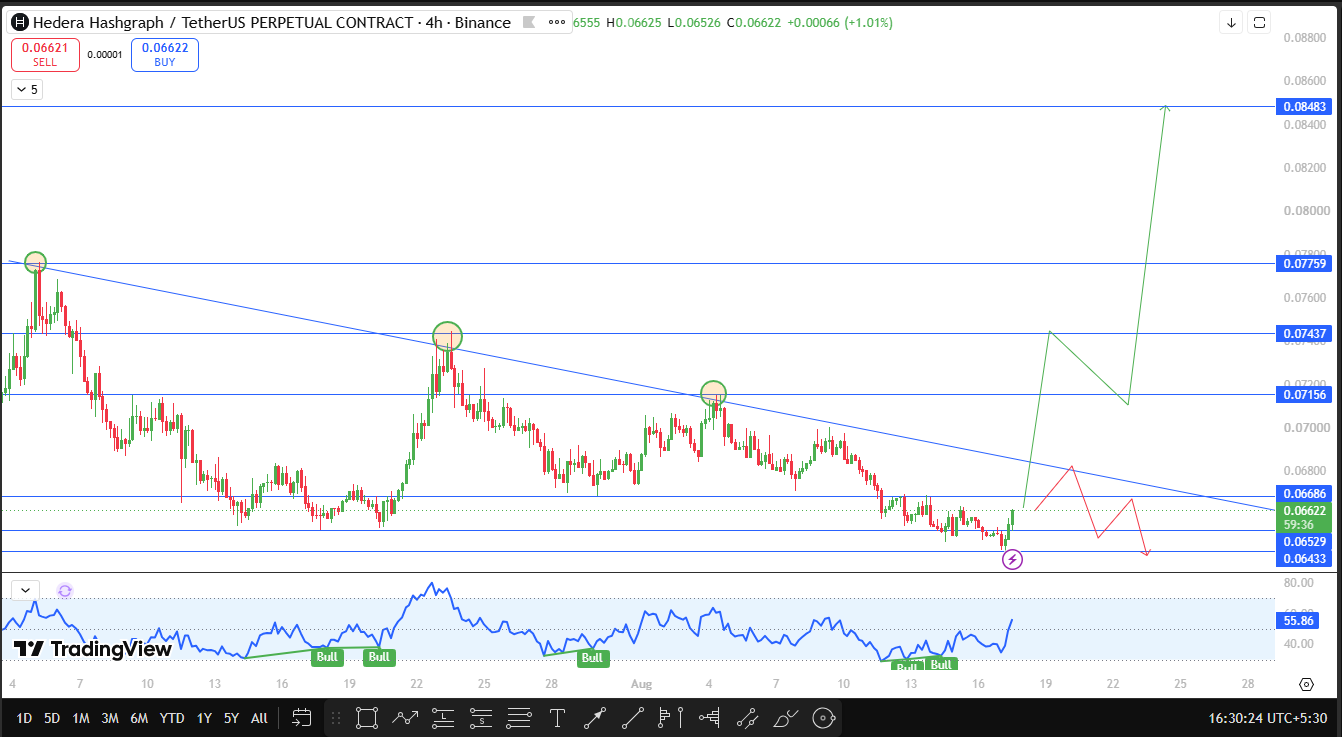
What stands out in this latest retest is that the selling has come in slower and weaker than the two rejections before it, and recent candles are showing genuinely good volume on the green bars.
The chart's built-in oscillator currently reads 55.86, with a bullish tag visible on recent candles, adding some weight to the idea that momentum is starting to shift.
If the price sustains itself near the trendline and then delivers an aggressive breakout, a close above $0.06686 would be the first confirmation.
Holding that level opens up a run through $0.07156, then $0.07437, then $0.07759, with $0.08483 marked as the extended target further out.
If instead the trendline rejects price again and HBAR closes below $0.06529, that would confirm the breakdown scenario, and the next support to watch would be $0.06433.
HBAR Technical Outlook Snapshot
Indicator | Signal |
Price Structure | Descending trendline retest, weaker selling than prior rejections |
Momentum Oscillator (RSI) | Reading near 55.86, a bullish tag is visible on recent candles. |
Immediate Bias | Neutral to cautiously constructive while holding near the trendline |
Bullish Trigger | 4H close above $0.06686 |
Bearish Trigger | 4H close below $0.06529 |
Invalidation | 4H close below $0.06433 |
HBAR Support and Resistance Levels to Watch
Type | Level | Note | % From CMP |
Resistance | $0.08483 | Extended target on sustained breakout | +28.09% |
Resistance | $0.07759 | Fourth resistance target | +17.18% |
Resistance | $0.07437 | Third resistance target | +12.31% |
Resistance | $0.07156 | First resistance target | +8.07% |
Breakout Trigger | $0.06686 | Confirms an aggressive trendline breakout | +0.97% |
Current Price | $0.06622 | Live CMP | 0% |
Support | $0.06529 | Breakdown trigger on trendline rejection | -1.40% |
Support | $0.06433 | Next support if $0.06529 breaks | -2.85% |
Risk-Reward Table
Case | Trigger | Target |
Bullish breakout | Sustains near trendline, closes above $0.06686 | $0.07156, then $0.07437, $0.07759, $0.08483 |
Bearish rejection | Trendline rejection, close below $0.06529 | $0.06433 |
What Would Change This HBAR Price Prediction?
A 4-hour close above $0.06686 with strong volume would be the clearest signal that this breakout attempt has real conviction.
On the other side, a rejection at the trendline followed by a close below $0.06529 would confirm the bearish path.
Given the recent flip in liquidation data toward longs over the past day, a renewed increase in long liquidations would also add weight to the bearish case.
How Bitcoin Sentiment Could Move HBAR
Hedera tends to move in step with broader Bitcoin sentiment, as most mid-cap altcoins do during periods of heavy leverage.
A stable or rising Bitcoin would likely support HBAR's push through $0.06686 and toward the resistance levels above.
A risk-off shift in Bitcoin would make a trendline rejection and a close below $0.06529 more likely, even with the recent slowdown in selling pressure.
When This Hedera Price Prediction Gets Revisited
This hedera outlook will be revisited if HBAR closes a 4-hour candle beyond either $0.06686 or $0.06529, or if the liquidation balance shifts meaningfully again between longs and shorts.
Glossary
Descending Trendline: A falling resistance line connecting a series of lower highs, marking the structure of a downtrend
Open Interest: Total value of outstanding futures contracts not yet settled
Liquidation: Forced closure of a leveraged position once losses erode the required margin
Volume Heatmap: A breakdown showing how trading volume for an asset is distributed across different exchanges
Bull, Base, and Bear Case
Bull Case: HBAR sustains near the trendline, delivers an aggressive breakout, and closes above $0.06686, extending toward $0.07156, $0.07437, $0.07759, and eventually $0.08483 on continued strength.
Base Case: HBAR chops between $0.06529 and $0.06686 as the market waits for a decisive close in either direction, with the weaker recent selling keeping the setup balanced.
Bear Case: HBAR gets rejected at the trendline again and closes below $0.06529, confirming the downtrend is still intact, with $0.06433 as the next support to watch.
Disclaimer
This article is for informational purposes only and does not constitute financial advice. Cryptocurrency markets are highly volatile, and prices can move sharply in either direction. Always do your own research and consult a licensed financial advisor before making investment decisions.
Also read:













.webp)








