Hyperliquid Price Prediction: HYPE Nasdaq ETF News Fuels Big Rally

Hyperliquid launched in 2024 as a high-performance decentralized derivatives exchange built on its own Layer 1 blockchain, with $HYPE as its native token. HYPE is currently trading around $81.28 right now, up 0.2% on the day.
Market cap works out to roughly $18.081 billion, keeping Hyperliquid near rank #9 among all cryptocurrencies.
The rest of this Hyperliquid price prediction breaks down where HYPE might go from here.
Live Market Data
Metric | Value |
Price | $81.28 |
24h Change | +0.2% |
24h Range | $80.30 – $82.58 |
Market Cap | $18.081B |
Outstanding Token Value | $45.797B |
Fully Diluted Valuation | $77.65B |
24h Trading Volume | $1.09B |
Total Value Locked (TVL) | $6.659B |
Circulating Supply | 222.446M |
Outstanding Supply | 563.427M |
Total / Max Supply | 955.307M / 1B |
Source: HYPE market cap data taken from CoinGecko, data as of Sep 03, 2026. Figures may vary slightly across other tracking websites.
Exchange Volume
Most of HYPE's futures volume is concentrated on a handful of exchanges. Binance leads by a wide margin at $576.23M over 24 hours, with LBank ($378.88M) and Hyperliquid's own platform ($279.41M) next in line.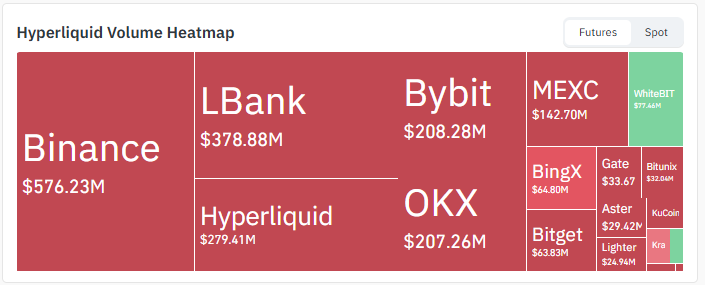
Source: Volume Heatmap Data Taken From CoinGlass, As of Sep 3, 2026
Bybit adds another $208.28M, closely followed by OKX at $207.26M. MEXC, WhiteBIT, Bitget, BingX, Gate, Aster, Bitunix, Lighter, and KuCoin fill out the rest, each somewhere between $24M and $143M.
Total 24-hour volume across the board comes to roughly $1.09B, a healthy sign of liquidity given the current price range.
Liquidation Snapshot
The liquidation picture over the last 24 hours is fairly balanced, with $824.86K in longs wiped out against $739.11K in shorts, out of $1.56M total.
That kind of two-sided flush is typical of a market chopping inside a tightening range rather than trending hard in one direction.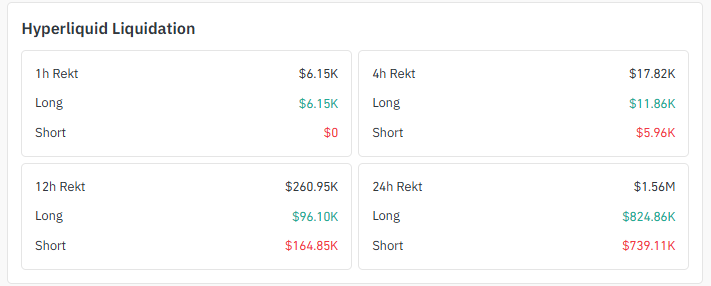
Source: Liquidation Data Taken From CoinGlass, As of Sep 3, 2026
Zoom into the 12-hour window, and shorts actually took the bigger hit, $164.85K liquidated versus $96.10K in longs, pointing to a push higher during that stretch.
But the most recent 4 hours flip that around, with $11.86K in longs liquidated against just $5.96K in shorts, suggesting a small pullback into current levels.
This back-and-forth liquidation pattern lines up closely with price compressing inside a symmetrical triangle, where both sides keep getting caught out as the range narrows.
Hyperliquid News
Hashdex confirmed that its Nasdaq-listed NCIQ multi-asset crypto ETF now holds Hyperliquid's HYPE token, effective September 1, after the token cleared the Nasdaq CME Crypto Index rules.
The addition takes the fund's holdings from eight coins to nine.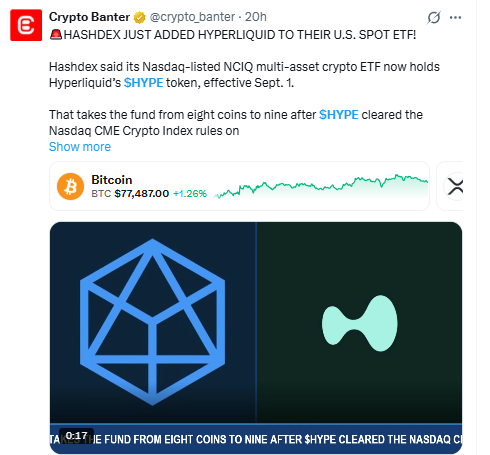
Source: Data Taken From @Crypto_banter, X Account, As of Sep 03, 2026
This kind of inclusion in a regulated, exchange-traded product is a meaningful fundamental signal, since it reflects growing institutional recognition of $HYPE alongside more established assets.
As with most fundamental catalysts, though, the near-term price path is still likely to be shaped by the technical structure on the chart.
Technical Analysis
Symmetrical Triangle and Wolfe Wave Structure
Zoom in on the 4-hour chart, and HYPE has been carving out a symmetrical triangle, with lower highs pressing against higher lows as the range compresses.
The price is currently trading close to the lower boundary of that structure.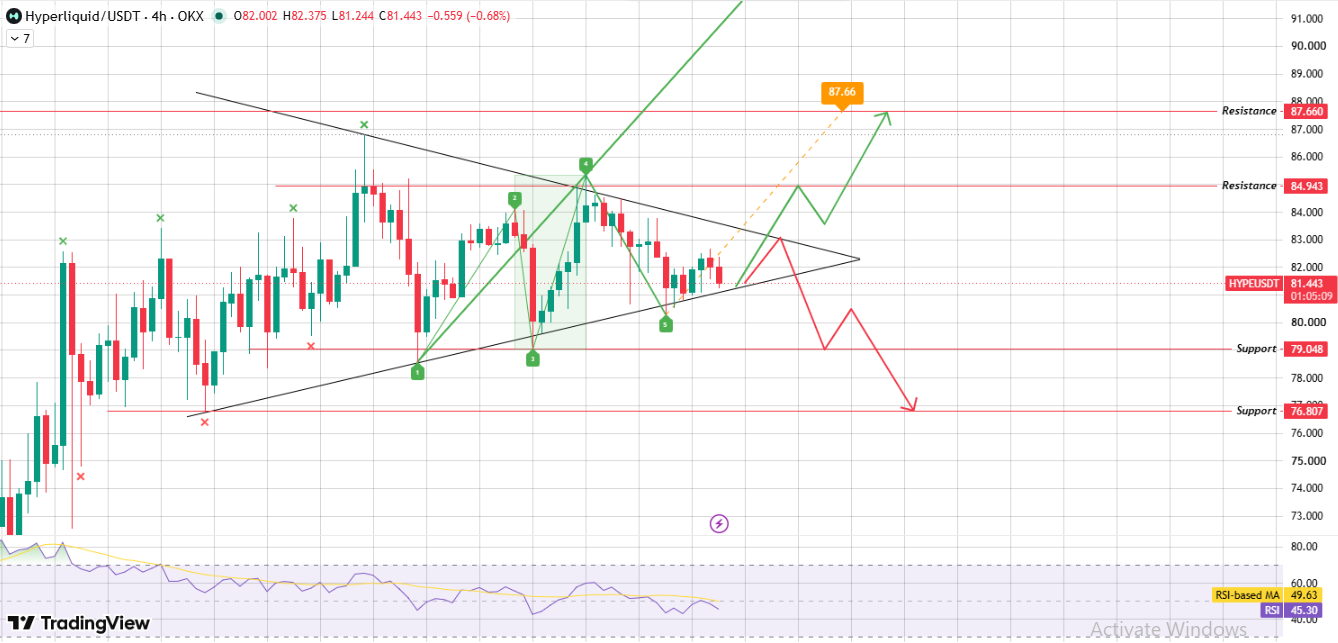
Source: Chart Taken From TradingView, As of Sep 3, 2026
Overlaid on the same chart is a Wolfe Wave pattern, a five-point structure often used to spot a coiling market ahead of a decisive move.
The pattern's projected level sits near $87.660, matching up closely with the chart's own resistance level above.
Momentum Check
RSI is reading 45.30, sitting just below its own moving average of 49.63. That's a soft, slightly bearish-leaning reading, consistent with price still testing the lower half of the triangle rather than showing strong upside momentum yet.
Breakout and Rejection Scenarios
Here's the setup for continued upside: HYPE bounces from the triangle's lower boundary, pushes back up to the falling trendline (upper boundary), and breaks through it with strength.
If the Wolfe Wave structure plays out, that would put $84.943 in play first, with the projected level of $87.660 as the next level above it in this HYPE price prediction.
The other side looks different. If price gets rejected at the falling trendline and slides back down to the triangle's rising support, a clean break below that trendline would signal the structure has failed to the downside.
In that case, $79.048 is the first support to watch, with $76.807 waiting underneath it.
Support and Resistance Levels (4H Chart)
Level Type | Price |
Resistance 2 (Wolfe Wave Level) | $87.660 |
Resistance 1 | $84.943 |
Support 1 | $79.048 |
Support 2 | $76.807 |
Levels reference the 4-hour candle close on the HYPE/USDT chart, OKX, and UTC.
Bull, Base, and Bear Case for HYPE
Scenario | Trigger | Price Level |
Bull Case | HYPE bounces off the triangle's lower boundary and breaks above the falling trendline (upper boundary) | $84.943, then $87.660 |
Base Case | HYPE continues to compress inside the symmetrical triangle, holding between the rising and falling trendlines. | Range-bound between $79.048 and $84.943 |
Bear Case | Price is rejected at the falling trendline and closes below the triangle's rising support. | $79.048, then $76.807 |
Symmetrical Triangle: A consolidation pattern formed by a falling trendline connecting lower highs and a rising trendline connecting higher lows, converging toward an apex. Price typically breaks out sharply in one direction once the pattern tightens.
Wolfe Wave: A five-point chart pattern used to identify a coiling market that's likely to make a strong, often measured move once the structure resolves. The projected level is drawn from the pattern's internal points.
RSI: Short for Relative Strength Index. It's a 0-100 oscillator built to measure how fast and how far price has moved recently, and it's most useful for spotting when a move has gotten overextended.
Getting liquidated means a leveraged futures position gets force-closed because there isn't enough margin left to cover the loss. When liquidations run roughly even on both sides, it usually points to a choppy, range-bound market rather than a strong trend.
TVL (Total Value Locked): The total value of assets deposited or flowing through a protocol in Hyperliquid's case, the value secured across its trading and lending infrastructure.
Disclaimer: This Hyperliquid price prediction draws on technical chart analysis and publicly available market data, and it isn't financial advice. HYPE is volatile, and the price could fall well below the support levels covered here if broader market conditions sour. Past patterns and indicator signals don't guarantee what happens next, and actual price action may look nothing like the scenarios above. Do your own research and weigh your own risk tolerance before acting on any of this.
Also read:
















