Zcash Price Prediction: A Huge Rally Coming for $ZEC? IMP Levels


Zcash just pushed to fresh highs, and the chart behind $ZEC is getting attention across crypto trading circles right now.
The Zcash price is holding near $828.318, up on the day, after one of the sharpest moves privacy coins have seen in previous months.
This Zcash price prediction breaks down the liquidation data and the key levels that decide if the breakout has more room to go.
Market data was checked on September 3, 2026, at 16:13 IST.
Zcash Price Prediction Today: Market Overview
| Metric | Value |
| Price | $828.318 |
| 24h Change | +5% |
| Market Cap | $13.99B |
| FDV | $17.44B |
| 24h Volume | $631.54M |
| Vol/Mkt Cap (24h) | 4.5% |
| Total Supply | 16.85M ZEC |
| Max Supply | 21M ZEC |
| Circulating Supply | 16.85M ZEC |
Source: Data from CoinMarketCap as of September 3, 2026, at 16:13 IST. Figures may vary slightly across other tracking websites.
ZEC Liquidation and Volume Data
Short sellers have taken the bigger hit as ZEC has climbed.
Total liquidations over 24 hours reached $6.50M, split between $2.94M in long liquidations and $3.56M in short liquidations.
The 12-hour window shows the imbalance even more clearly, with $809.05K in shorts wiped out against just $135.19K in longs, a sign the move has been catching short sellers off guard.
Futures volume is led by Binance at $968.92M, followed by OKX at $488.24M and LBank at $349.12M, with Bybit, Hyperliquid, and several other exchanges adding meaningful volume behind them.
Zcash Crypto News Today: What Traders Are Saying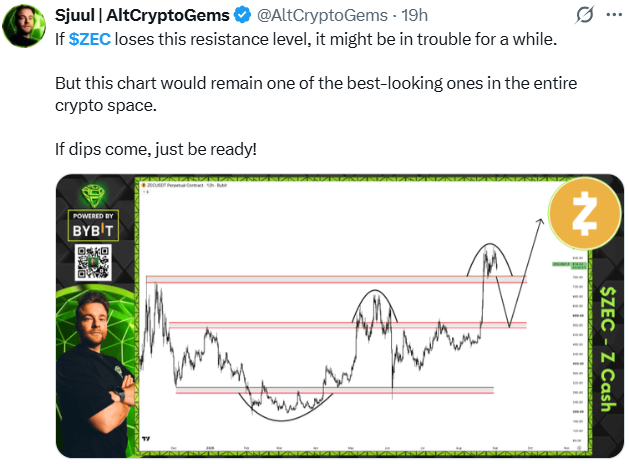
A crypto trader on X , who posts as AltCryptoGems, recently flagged the current resistance zone as the level that decides ZEC's next move, noting that losing it could stall the rally for a while, but that the chart would still remain one of the strongest-looking setups in the market even after a pullback.
Zcash Chart Analysis
Pair: ZEC/USDT · Market: Crypto (KuCoin) · Timeframe: 1D · Source: TradingView · Timestamp: September 3, 2026, 16:13 UTC+5:30
ZEC is consolidating tightly after its late-August breakout, currently trading at $828.318.
Price is holding inside a defined range between $764.342 support and $900.325 resistance, the shaded zone marking where buyers and sellers are fighting it out after the sharp move up from the $700 base.
This range is the key near-term battleground: EMA 20 at $743.839 and EMA 50 at $634.543 sit well below, both now acting as support rather than resistance.
A breakout above $900.325 opens the path toward the $1,153.010 (1.618 Fib) and $1,566.903 (2.618 Fib) extensions, while losing $764.342 would put the consolidation and the recent breakout back in question. 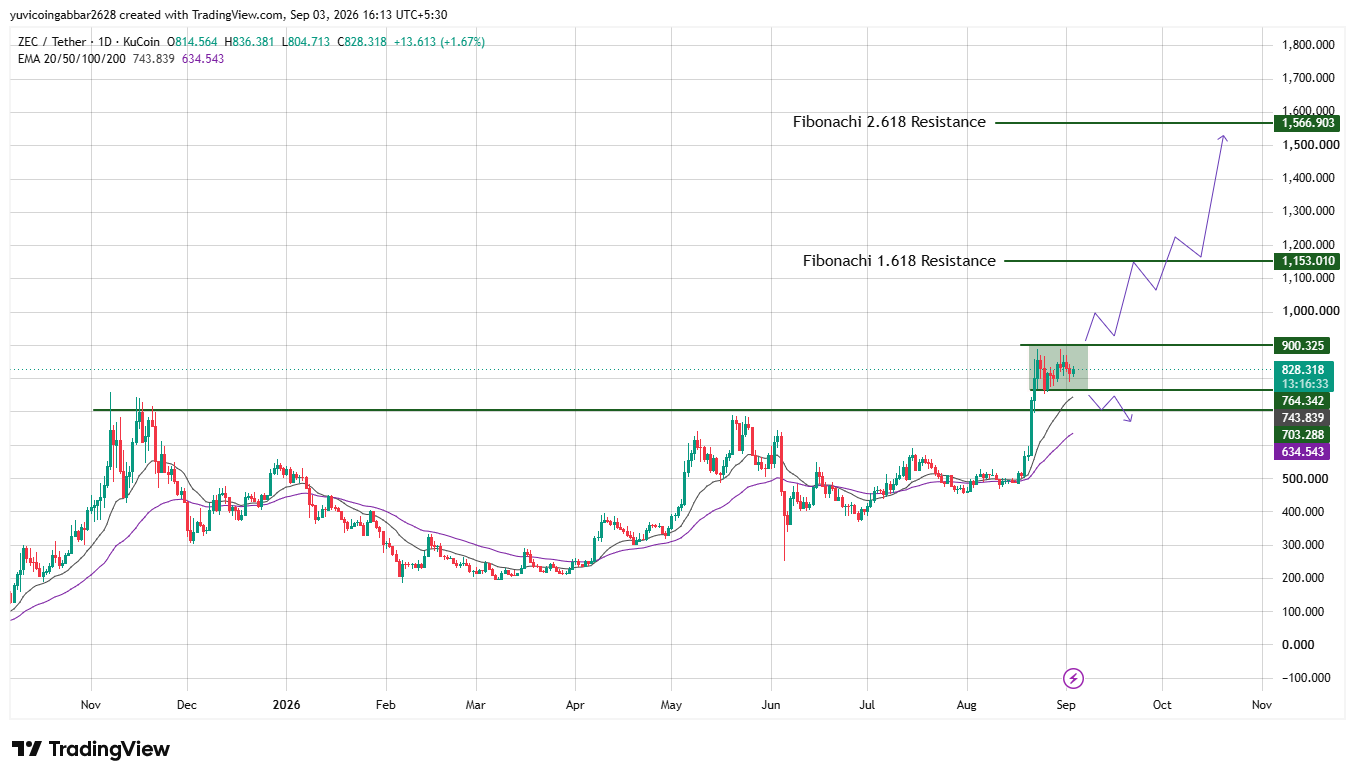
Key Levels
| Level | Price |
| Resistance 3 (Fibonacci 2.618) | $1,566.903 |
| Resistance 2 (Fibonacci 1.618) | $1,153.010 |
| Resistance 1 | $900.325 |
| Immediate Price Reference | $828.318 |
| Support 1 | $764.342 |
| Support 2 | $703.288 |
Bull Case vs Bear Case
Bull case: Holding support 1 at $764.342 and clearing resistance 1 at $900.325 keeps the breakout alive and opens the door toward $1,153.010.
Bear case: A close back below $764.342 would put the breakout in question, with support 2 at $703.288 as the next level down.
Can $ZEC Reach $1,566.903?
$1,566.903 is the highest level on the chart, marked as the Fibonacci 2.618 resistance.
Getting there would take $ZEC clearing $900.325 first, then holding above the $1,153.010 extension, a multi-stage move rather than a single leg from here.
$ZEC vs Bitcoin: How the Move Compares
Bitcoin has been comparatively steady this week, with most bitcoin price prediction chatter centered on BTC price holding its range rather than a sharp breakout.
Zcash is the opposite story, up sharply and pushing to fresh highs on volume that has stayed elevated for days, not just hours.
That kind of sustained move is rare for an altcoin this size, and it's part of why ZEC is drawing more attention than BTC price action this week, even though Bitcoin still sets the tone for the broader market.
Zcash Price Prediction: Expert View
According to CoinGabbar analysts , The liquidation data lines up with the breakout: shorts, not longs, have taken the bigger hit, and the price is holding well above its EMA cluster for the first time in months.
The $764.342 to $900.325 zone is the one to watch.
Disclaimer
This article is meant to inform, not to tell you what to do with your money. The levels covered here come from chart analysis and data that was public at the time of writing, and ZEC has already shown how fast that can change in a single day. Treat this as one input among many, do your own research, and only risk what you can afford to lose.
















