Hyperliquid Price Prediction September 2026:HYPE Surges 35%


HYPE has been on an absolute tear, and the chart is now sitting in territory most coins never reach.
After pushing to a fresh all-time high and holding onto the move, traders are asking how much further this run has left in it, and this Hyperliquid price prediction September 2026 lays out exactly what the setup looks like from here.
The coin is also quietly outpacing every major asset in the market right now, adding real weight to a chart that's already impressive on its own.
HYPE Price Today: Live Data and 24-Hour Change
$HYPE is trading near $81.856 on the weekly chart.
Separate live data from CoinGlass puts the coin around $81.547, up roughly 4.94% over the past 24 hours, with futures volume of $4.50 billion against spot volume of $313.39 million and open interest at $3.51 billion.
Market cap stands at $20.36 billion on a circulating supply of 251.97 million , against a total and max supply of 952.24 million tokens, meaning just over a quarter of all HYPE that will ever exist is currently in circulation.
Source: TradingView (HYPE/USDT perpetual, Binance, weekly chart) and CoinGlass, both accessed August 25, 2026, IST.
HYPE News: Outperforming Every Major Asset
Fresh data shared roughly 17 hours before this piece by Hyperliquid Daily shows HYPE leading every major crypto asset over the past 7 days.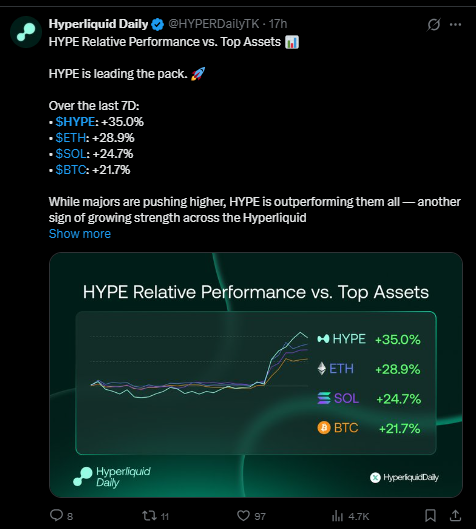
$HYPE gained 35.0% in that stretch, ahead of ETH at 28.9%, SOL at 24.7%, and BTC at 21.7%.
That kind of relative strength, outperforming the majors by a wide margin during a period when they're all pushing higher too, is the kind of signal that tends to draw fresh attention and fresh capital toward a coin already in breakout mode.
Source: X post by @HYPERDailyTK, posted roughly 17 hours before this piece, August 25, 2026.
Quick Take
CMP: $81.856
Weekly trigger: close above $83.550, opens $100.000, then $150.000
Weekly failure: close below $51.259 invalidates the bullish structure
Data as of August 25, 2026, IST
Short risk note: these levels come from the weekly chart and depend on confirmed weekly closes, not intraday wicks. Leveraged positions around these zones carry liquidation risk if price whipsaws before a level is confirmed.
Hyperliquid Technical Forecast September 2026
Price is currently trading right near its all-time high, and the path to get there says a lot about the strength behind this move.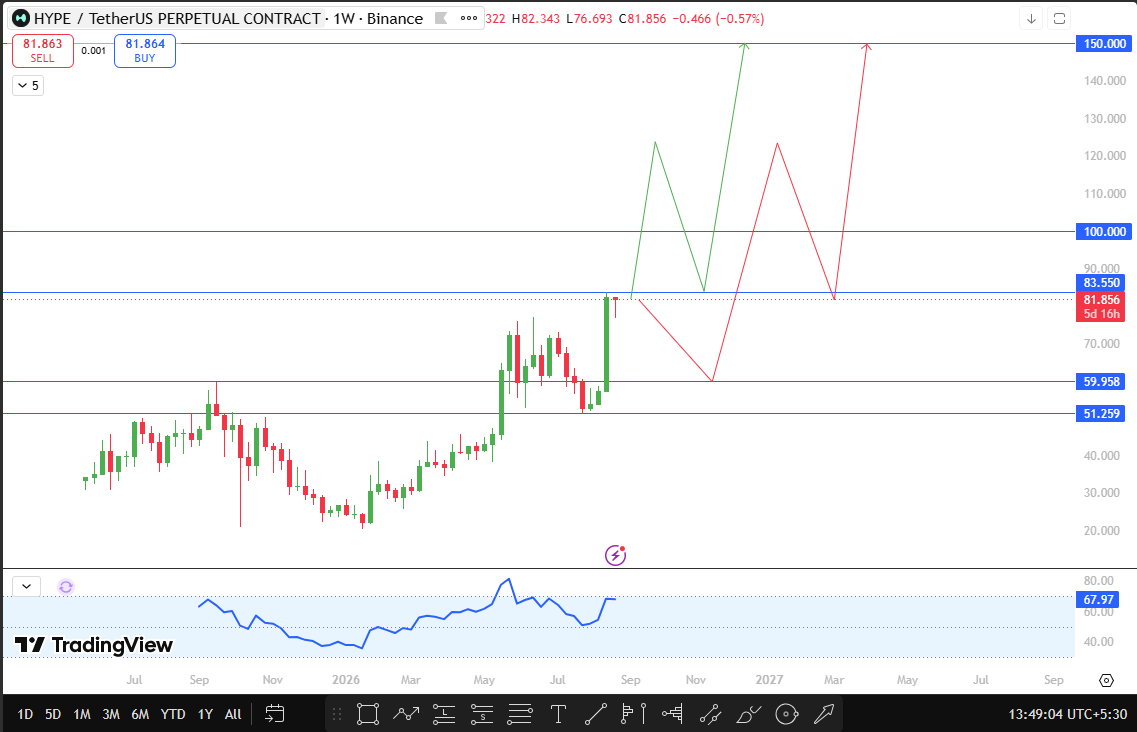
Price recently broke through its previous all-time high to set a fresh one, then pulled back to retest that breakout zone rather than reversing outright.
That retest was met with another large, decisive bullish candle, a sign buyers are still firmly in control rather than distributing into strength.
If price breaks and closes a weekly candle above $83.550, the next resistance is the psychological $100 level, a round number that tends to attract both profit-taking and fresh momentum buying in equal measure.
Beyond that, $150 stands out as the next major psychological resistance if the move keeps extending.
On the downside, a weekly close below $51.259 would invalidate this bullish structure entirely, suggesting the retest and breakout pattern failed rather than held.
Source: TradingView, HYPE/USDT perpetual chart, 1-week timeframe, Binance, captured August 25, 2026, IST.
HYPE Support and Resistance Levels to Watch
Level Type | Price | Note |
Support | $59.958 | Chart-marked reference below current price |
Support | $51.259 | 1W close below this invalidates the bullish setup. |
Resistance | $83.550 | The weekly close above this confirms continuation. |
Resistance | $100.000 | Psychological round-number resistance |
Resistance | $150.000 | Next major psychological resistance |
HYPE Price Prediction: Bull, Base, and Bear Cases
The base case has $HYPE continuing to consolidate just under $83.550 through most of September, digesting its recent all-time-high breakout without a confirmed weekly close beyond either side of the current range.
The bull case activates on a 1W close above $83.550, which opens a path toward the $100 psychological level and eventually $150 if momentum keeps building.
This case gets extra support from HYPE's outperformance against every major asset over the past week.
The bear case needs a close below $51.259, which would undo the recent all-time-high breakout and call the entire retest structure into question.
Every one of these HYPE price prediction September 2026 scenarios depends on a confirmed weekly close, not a temporary wick through any level.
Risks That Could Invalidate This Forecast
This bullish setup fails if Price cannot close a 1W candle above $83.550 and fails more seriously if the price closes below $51.259, which would undo the all-time-high breakout structure entirely.
Broader risks include shifts in Bitcoin dominance, macro liquidity conditions, and general crypto market volatility, any of which could override HYPE's own chart structure regardless of where its levels sit.
Glossary
All-time high (ATH): the highest price an asset has ever traded at
Retest: when the price returns to a previously broken level to confirm it now acts as support rather than resistance
Weekly close: the final traded price when a weekly candle finishes, used to confirm whether a breakout or breakdown is genuine
Psychological level: a round number that tends to influence trader behavior beyond its technical significance
Support: a price zone where buying pressure has previously stepped in
Resistance: a price zone where selling pressure has previously capped upside
Invalidation level: the price point at which a forecast scenario is considered incorrect
Disclaimer
This article is for informational purposes only and does not constitute financial advice. Cryptocurrency markets are highly volatile, and all price levels discussed are based on technical chart analysis, not a guarantee of future performance. Readers should conduct their own research before making any investment decisions.
Also read:

















