Lido DAO Price Prediction: Can LDO Hold This 13% Weekly Rally


A shorts-heavy crypto week just turned into a short squeeze for one of Ethereum's biggest staking tokens, and the wallet data behind it tells a story most price charts alone won't show you.
Why Lido DAO Is Trending Today and What Happens After the Squeeze
Something's been building in Lido DAO price prediction searches all week, and it isn't just another green candle. LDO is up sharply on the day, sitting near its best level in weeks, right as the token's own ecosystem dropped a real product update. Traders who'd bet against it got run over. And now everyone's asking the same thing: does this have legs, or is it just shorts getting cleared out?
We'll get into the chart, the liquidation data, and the fundamentals below. But the honest answer sits somewhere between "this is real" and "don't get carried away." Keep that in mind as you read on.
Moves like this tend to show up whenever the wider altcoin market gets a fresh wave of risk appetite, and LDO just happened to have real news to go along with it.
KEY TAKEAWAYS
Direction: Short-term momentum is bullish, driven by a short squeeze and fresh product news; the weekly chart shows a multi-year falling wedge breaking to the upside.
Why it moved: A wave of forced short liquidations combined with the launch of the Nansen ETH Vault on Lido V3 pushed LDO out of its base.
Near-term range: Roughly $0.38 to $0.45 while the current daily channel holds.
Invalidation: A daily close back below $0.35 would put the breakout thesis in real doubt.
Coin Overview
Metric | Value (as of Jul 21, 2026) |
Name / Ticker | Lido DAO / LDO |
Blockchain | Ethereum (ERC-20) |
Contract Address | 0x5a98fcbea516cf06857215779fd812ca3bef1b32 |
Price | $0.3996 to $0.4022 (+12.69% to +13.45% 24h, depending on source) |
Market Cap | $334.27M |
Unlocked Market Cap | $359.69M |
Fully Diluted Valuation (FDV) | $399.68M |
24h Volume | $63.11M (+112.54%) |
Vol/Mkt Cap (24h) | 18.71% |
Liquidity/Mkt Cap | 0.45% |
TVL | $17.69B |
Market Cap / TVL | 0.01886 |
Circulating Supply | 836.36M LDO |
Total Supply | 1,000,000,000 LDO |
Holders | 86.13K (CoinMarketCap) / 65,775 (Etherscan) |
CertiK Rating | 4.6 / 5 |
All-Time High | $18.62 (Nov 16, 2021, -97.86% from here) |
All-Time Low | $0.2367 (Jun 26, 2026, +68.64% from here) |
Data pulled from LDO data on CoinMarketCap and the LDO token contract on Etherscan. Prices move fast, so treat anything more than a few hours old as historical.
Technical Analysis: What's Driving the Move
On the daily LDO chart, price has been climbing inside a clean ascending channel since late June, grinding from around $0.25 up to today's $0.40 print. Higher lows, higher highs.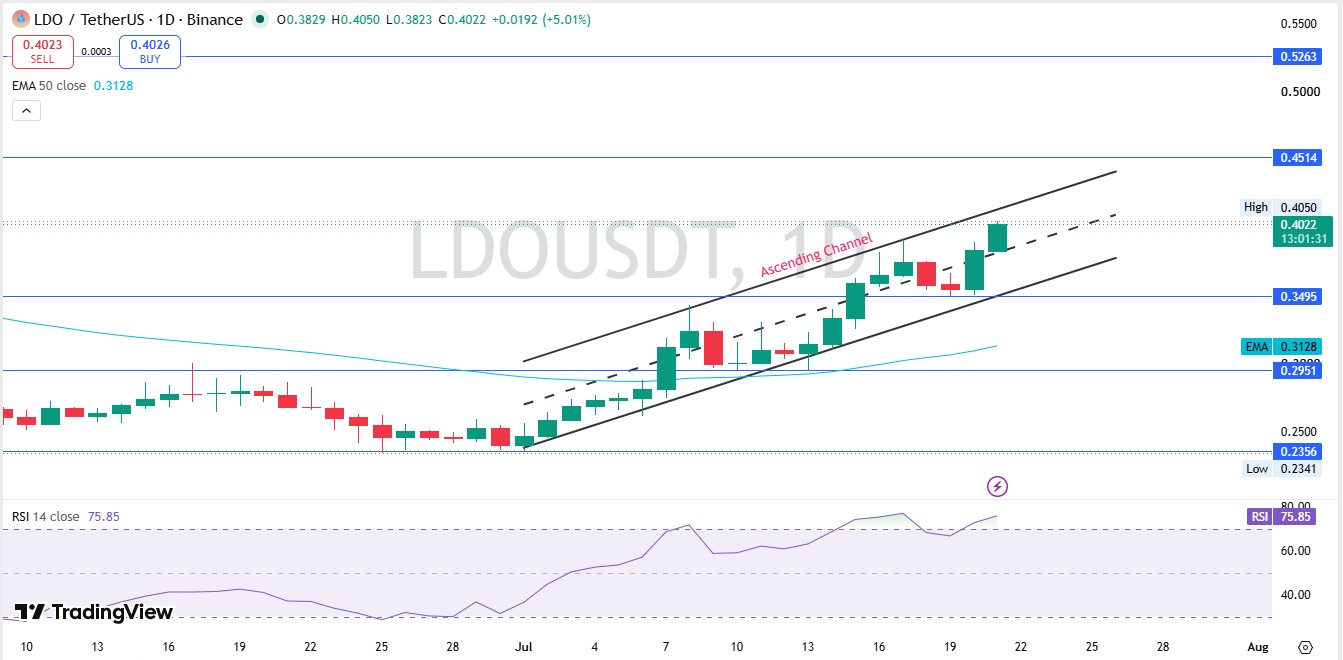
Today's candle alone opened at $0.3829 and hit a high of $0.4050, a 5.01% intraday move. The 50-day EMA sits way down at $0.3128, meaning price has stretched well above its own average. That's not nothing.
Daily RSI reads 75.85. That's overbought. Not a guaranteed reversal, but a level where pullbacks tend to happen.
Here's the thing though: zoom out to the weekly chart, and the picture changes completely. LDO has spent nearly three years grinding lower inside a falling wedge, a pattern where price makes both lower highs and lower lows that converge toward a point. And this week's candle just broke above that wedge's upper boundary.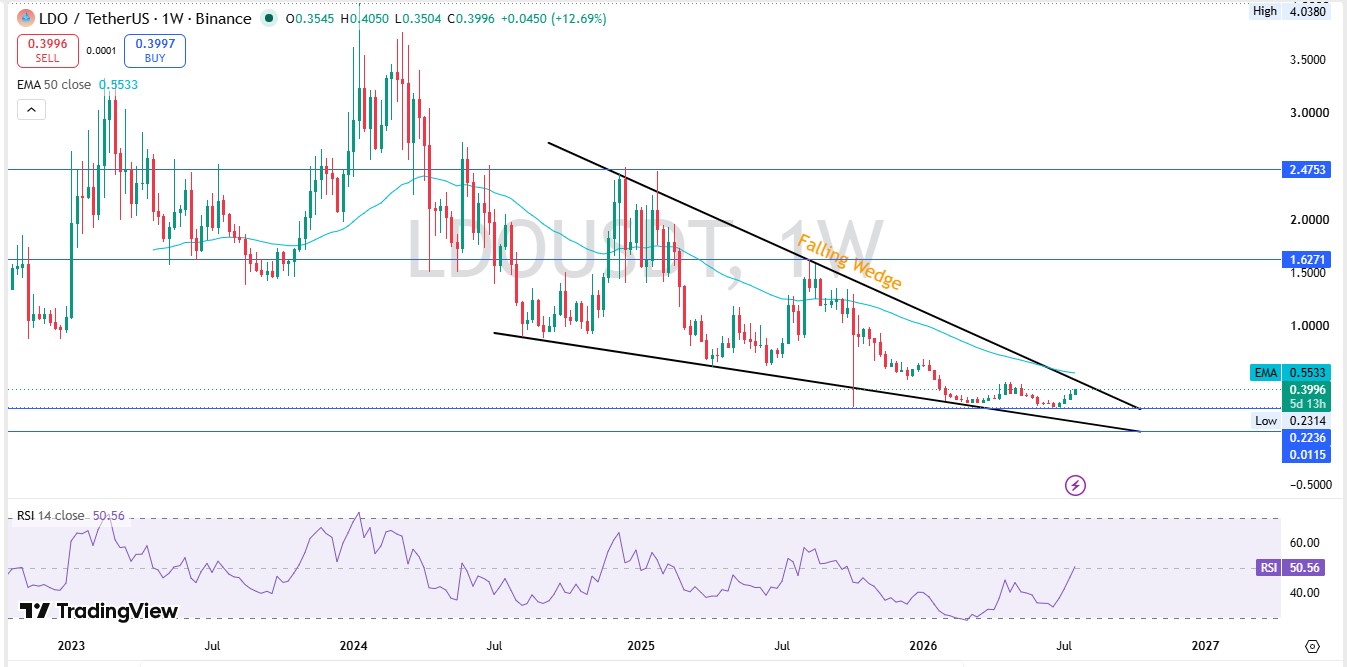
Weekly close came in at $0.3996, up 12.69% for the week. Weekly RSI sits at a much calmer 50.56, right in the middle of its range. That gap between an overbought daily and a neutral weekly is worth sitting with.
Key levels on the current structure
Immediate resistance: $0.4050 (today's high), then $0.4514, then $0.5263
Immediate support: $0.3823 (today's low), then $0.3495, then $0.2951
Weekly wedge resistance zone: roughly $1.6271, a long way off and only relevant if this breakout has real staying power
Weekly structural support: roughly $0.2236 to $0.2314, near the recent all-time low
None of these levels are magic. They're just where price has reacted before, the same kind of zone we flagged in the recent XRP resistance rejection setup.
Breaking Down the Short Squeeze
We pulled the LDO liquidation data on Coinglass expecting a fairly even mix. It wasn't even close.
Over the last 24 hours, $504.99K in LDO positions got liquidated. Of that, $458.24K came from shorts. Longs accounted for just $46.75K.
Same story over 12 hours: $385.20K total, $339.08K of it in shorts. In over 4 hours, $74.98K total, with $58.68K from shorts.
Traders betting against LDO got forced to buy back their positions as price climbed, and every one of those forced buybacks added fuel to the move. That's a squeeze. It's real, and it explains a lot of today's speed.
But squeezes run out of breath eventually. Once the forced buying stops, the move has to stand on its own.
Where the Volume Is Actually Coming From
Next, we checked the Lido DAO volume heatmap to see whether this is real spot demand or leverage doing the work.
Turns out, it's mostly spot. Binance leads with $30.81M, OKX follows at $21.75M, and MEXC adds $9.70M. Bybit contributes $11.58M, with KuCoin, WhiteBIT, Bitunix, and BingX rounding things out in smaller amounts.
Compare that to the derivatives-heavy setups behind the broader crypto market rally we've flagged elsewhere, and LDO looks different. This is spot buyers showing up on major exchanges, not futures traders piling into a squeeze on thin books alone.
That matters. Spot-driven rallies tend to hold up better than pure leverage plays.
Fundamentals: The Nansen and Lido V3 Connection
LDO powers Lido, the largest liquid staking protocol built on the Ethereum network, and this week brought a real product launch, not just a rumor.
On July 17, Lido announced the Nansen ETH Vault, built on stVaults inside Lido V3. It's Nansen's first Ethereum staking product, and it lets users stake ETH directly to Nansen-operated validators while staying inside the Lido ecosystem.
We checked the official Nansen announcement directly rather than take the headline at face value. It confirmed the news, calling it a way to research, trade, and stake without ever leaving the platform. That's a genuine integration between two names people already trust, not a vague partnership rumor.
Lido followed up with a second post walking through how the vault works, framing it as proof that Lido V3's modular vault system is already attracting outside builders. For a protocol whose entire pitch is being the default liquid staking layer, that's exactly the kind of validation bulls want to see.
The Catch: Holder Concentration
A token with $17.69B in TVL sounds unstoppable on paper. But the holder data tells a more concentrated story than most people realize.
Top 100 wallets control 80.05% of supply. Whale wallets, just 0.38% of all holders, hold 88.38% of market cap. The Gini distribution score sits at 0.9908, about as concentrated as it gets, with only 13 wallets owning at least 1% of total supply each.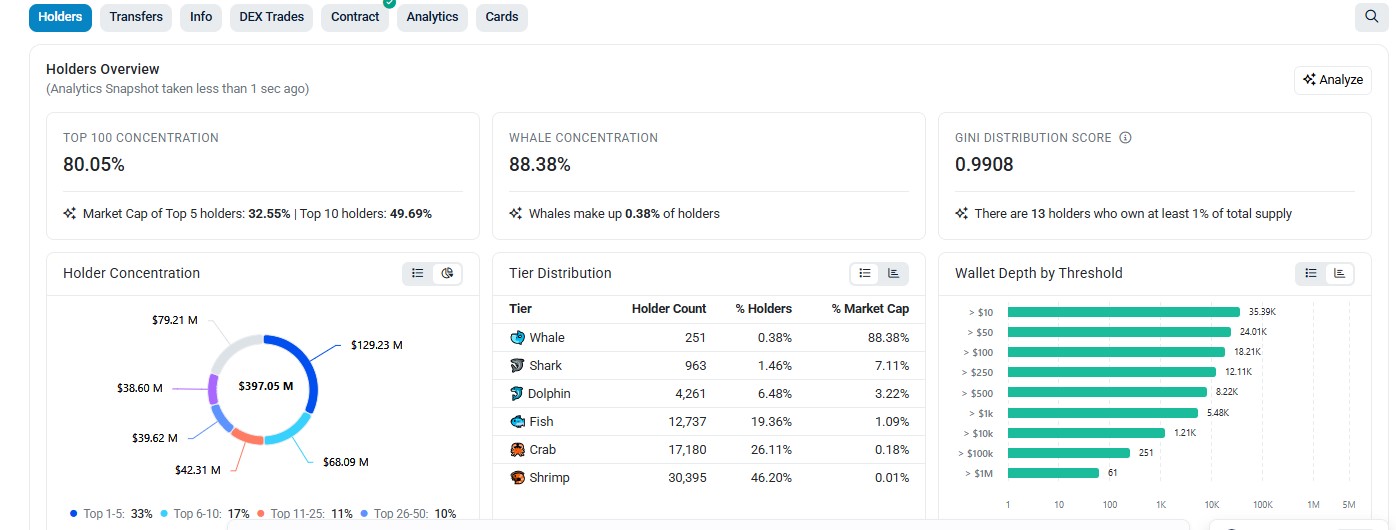
We cross-checked this against the LDO holder rankings on Etherscan directly. Lido's own agent wallet holds 11.47% ($45.99M), Binance's hot wallet 20 holds 6.13% ($24.57M), and several Lido vesting recipient wallets each control between 3% and 5% of the supply. Exchange wallets from Binance, Bybit, and OKX show up repeatedly in the top ten.
None of that means anything is wrong. Vesting wallets and protocol treasuries are normal for a project this size. But it does mean a small number of addresses could move price meaningfully if they decide to.
Worth watching.
Tokenomics and Supply Risk
The circulating supply sits at 836.36M LDO out of a 1 billion total supply, leaving roughly 163.64M tokens still to enter circulation over time. That gap is part of why FDV ($399.68M) runs higher than market cap ($334.27M), a dynamic worth comparing against new token supply unlocks happening elsewhere in the market right now.
Liquidity/market cap sits at 0.45%, which is thin relative to the token's size, and it helps explain today's sharp move in both directions. Vol/mkt cap at 18.71% shows real turnover, not a dead market waiting around.
Market cap sitting at just 0.01886 of Lido's own $17.69B TVL is the number that stands out most here. LDO is a governance and incentive token layered on top of a protocol that's vastly larger than the token itself.
Historical Context
LDO's all-time high, $18.62, was set back in November 2021, nearly five years ago. From there, it's down 97.86%. That's a brutal drawdown by any measure.
The all-time low came far more recently. $0.2367, hit just 25 days ago on June 26, 2026. From that low to today's price, LDO is up 68.64%.
Read that timeline again. A token that spent years grinding toward its cycle low just bounced nearly 70% in under a month, and this week's squeeze and product news pushed it further. That kind of recovery often lines up with periods when capital rotates back into altcoins after Bitcoin and Ethereum lead a broader move.
Scenarios: Bull, Base, and Bear
Using the same bull-bear base case framework applied across major assets, here's how LDO's setup breaks down.
Scenario | Conditions | Target | Timeframe | Invalidation |
Bull Case | Weekly wedge breakout confirms, Nansen vault drives real TVL growth, shorts stay squeezed | $0.45 to $0.53, longer term toward $0.63 | 2 to 6 weeks | Daily close below $0.35 |
Base Case | Price consolidates inside the daily channel, RSI cools off | $0.38 to $0.45 range-bound | Days to a few weeks | Break of either channel boundary on volume |
Bear Case | Squeeze exhausts, daily RSI unwinds hard, thin liquidity gets tested | $0.30 to $0.2951, possible retest of $0.2367 low | Days to weeks if triggered | Recovery only if price reclaims $0.4050 and holds |
The bear case isn't a throwaway line here. Liquidity sits under 1% of market cap, and daily RSI at 75.85 is stretched. A fade in the Nansen headline could unwind a chunk of this move fast.
What Would Actually Change This Thesis
Bullish confirmation: A daily close above $0.4514 on rising spot volume, held for 48 hours.
Key support to watch: $0.3823 on the daily, then $0.3495.
Hard invalidation: A daily close below $0.35, which would put the wedge breakout in doubt.
Narrative risk: Any sign that TVL growth from the Nansen ETH Vault stalls, or that this week's move was purely short-covering, could pull momentum away fast. Worth checking the crypto events calendar for any Lido governance updates that might follow.
Lido DAO Long-Term Outlook: The Honest Version
Long-term, LDO's story isn't really about this week's candle. It's about whether Lido stays the dominant liquid staking layer on Ethereum as more protocols like stVaults attract outside builders such as Nansen.
The fundamentals here are stronger than a typical squeeze setup. $17.69B in TVL is real, the CertiK rating is solid at 4.6, and this week's product launch wasn't hype; it was a shipped feature with a named partner attached.
LDO's fate is tied tightly to staking demand on Ethereum itself, so it's worth tracking this alongside the wider Ethereum price outlook for 2026 rather than in isolation.
And yet, holder concentration is extreme, liquidity is thin, and daily RSI is stretched. Both things are true at once.
We're not calling this the start of a new multi-year LDO cycle just because one weekly candle broke a wedge. What we can say is that the fundamental case improved this week in a way the token's price hadn't fully caught up to before today's move, and any long-term target beyond the levels above should be treated as far more speculative than the near-term technical picture suggests. For comparison against other majors, see our broader crypto price predictions coverage.
Disclaimer: This article is for informational purposes only and isn't financial advice. Crypto markets are volatile, and tokens with thin liquidity or concentrated holder bases carry elevated risk of sharp price swings in both directions. Verify all figures independently before making any trading decision. Data sourced from CoinMarketCap, Etherscan, Coinglass, and TradingView as of July 21, 2026.
Also read:

















