MemeCore Price Prediction: The Next Big Move Starts Here


MemeCore price prediction searches have picked up as M presses into the tightest part of its recent trading range. Price has spent weeks compressing after an earlier sharp move, narrowing into a shape that rarely holds for long once it reaches this stage.
Liquidation data over the past day shows short positions taking the bulk of the damage, trading volume is concentrated on a small handful of venues, and both the short-term and long-term charts are converging on the same decision point at almost the same time.
This piece walks through the confirmed levels on each timeframe, the derivatives data behind them, and the specific conditions that would confirm or rule out each scenario.
Current Market Snapshot
| Metric | Value |
|---|---|
| Price | $1.23 (+0.89% 24h) |
| Market Cap | $1.63B (+0.92%) |
| Unlocked Mkt Cap | $2.3B |
| 24h Volume | $16.75M (+11.64%) |
| Vol/Mkt Cap | 1.02% |
| FDV | $12.36B |
| Total Supply | 5.39B M |
| Max Supply | 10B M |
| Circulating Supply | 1.32B M |
Source: Data From CoinMarketCap
One number here is worth sitting with before anything else: fully diluted value sits at $12.36B against a market cap of just $1.63B.
Only about 13% of MemeCore's eventual max supply is in circulation right now, which is a meaningfully wider gap than most established large-cap tokens carry, and it matters for anyone thinking about this as a long-term hold rather than a short-term chart trade.
Chart History Context
The 1-day chart shows MemeCore spiking to a local high above $3.30 before a sharp single-candle correction dropped price toward the $0.50–$0.90 range, where it based for a stretch before climbing back to current levels near $1.24.
That context matters for reading today's setup: the $2.8419 and $3.3733 levels referenced below as long-term breakout targets aren't new territory for $M they mark a return toward the zone visible earlier on this same chart, not a move into previously untested price.
Liquidation Heatmap: Shorts Absorbing the Pressure
Coinglass liquidation data flips the usual script here: short positions have taken almost all of the damage over the past day, not longs.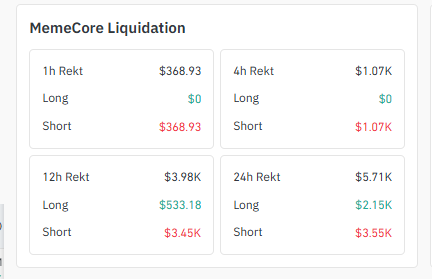
Source: liquidation data taken from Coinglass.
| Timeframe | Total Rekt | Longs | Shorts |
|---|---|---|---|
| 1h | $368.93 | $0 | $368.93 |
| 4h | $1.07K | $0 | $1.07K |
| 12h | $3.98K | $533.18 | $3.45K |
| 24h | $5.71K | $2.15K | $3.55K |
Every single window here shows shorts carrying the larger share, and two of the four windows show zero long liquidations at all.
That's consistent with a token that's been grinding higher into resistance; traders betting against the move have been the ones getting squeezed, not the buyers.
Exchange Volume Heatmap
As per Coinglass data, MemeCore's futures volume is concentrated on a small number of venues, with BingX ahead of the rest: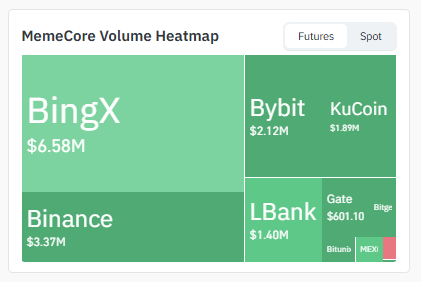
Smaller volume is also spread across Bitget, Bitunix, and MEXC.
Total tracked futures volume here is modest compared to larger-cap tokens, which is a liquidity factor worth keeping in mind: thinner order books can produce sharper, faster moves once either triangle boundary breaks.
4-Hour Chart: Apex of a Symmetrical Triangle
The 4H chart shows a clean, symmetrical triangle, with both the upper resistance line and lower support line converging almost exactly where price sits today, near $1.2406.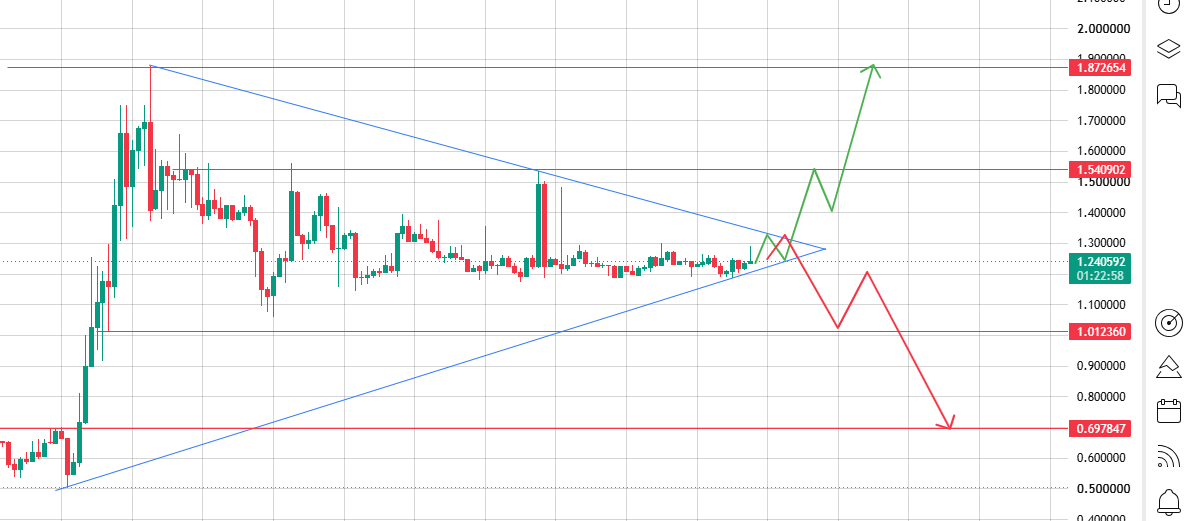
Source: Chart Taken From TradingView
-
Resistance level 1: $1.540902
-
Resistance level 2: $1.872654
-
Support zone 1: $1.012360
-
Support zone 2: $0.697847
Bullish breakout condition: a 4H close above $1.5409 confirms the move, with $1.8727 as the follow-through target.
Bearish breakdown condition: a 4H close below $1.0124 confirms the move, with $0.6978 as the next stop.
What invalidates this read: because the price is sitting right on the apex, a wick beyond either line without a full candle close back outside the triangle should be treated as noise, not confirmation.
1-Day Chart: Ascending Triangle Against Flat Resistance
The daily chart shows MemeCore inside an ascending triangle, a rising trendline of higher lows underneath, pressing into a flat horizontal resistance line at the top. Price is currently sitting right at that flat resistance, near $1.2396.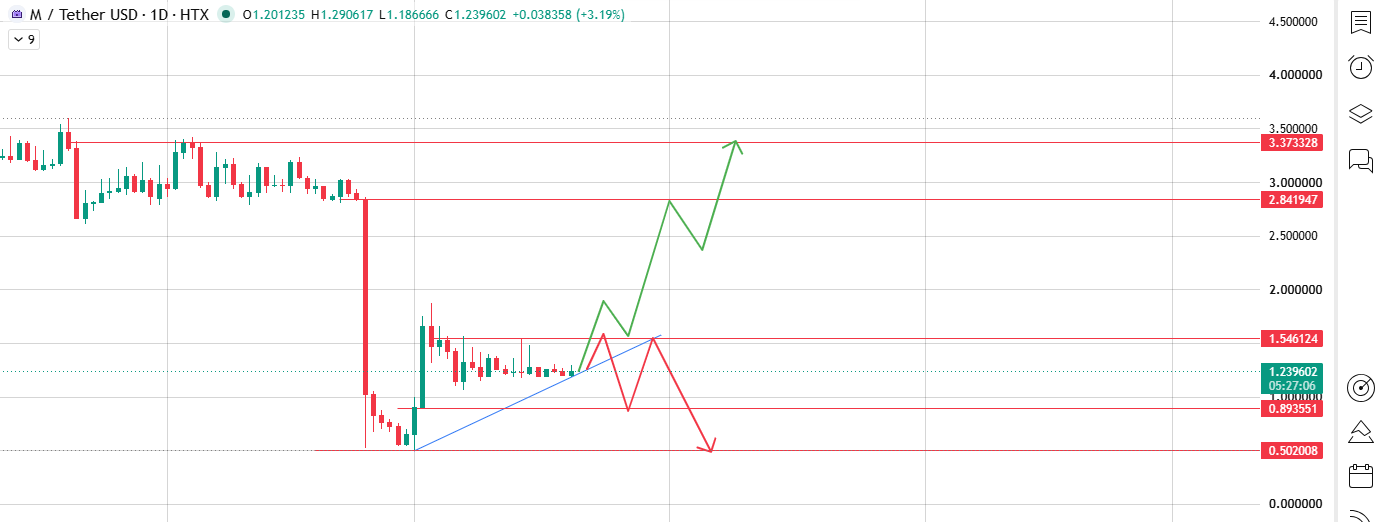
-
Flat resistance (triangle ceiling) / resistance level : $1.546124
-
Extended breakout targets: $2.841947 $3.373328
-
Support zone 1: $0.893551
-
Support zone 2: $0.502008
Bullish breakout condition: a daily close above $1.5461 confirms the move, opening the path toward $2.8419 first and $3.3733 if the move extends.
Bearish breakdown condition: a daily close back below the rising trendline and $0.8936 confirms the move, with $0.5020 as the deeper target.
What invalidates this read: ascending triangles typically resolve upward, but the flat resistance here has already capped the price more than once.
A single volatile daily candle shouldn't be read as a breakout without a full close and follow-through the next session.
Risk-Reward Snapshot
A single reference table combining both timeframes' mechanical reward-to-risk profile:
This is a simple price-distance calculation, not a probability estimate. It doesn't account for order-book depth, funding rates, or open interest.
Those weren't available in the source data for this update and would strengthen a future revision.
Three-Scenario Outlook
BTC Dominance and ETH Correlation Context
MemeCore doesn't trade in isolation from the broader market, and that matters more for a lower-liquidity token like this one than it would for a larger-cap coin.
BTC dominance swings shape how much capital is available to rotate into smaller altcoins in the first place.
A rising BTC dominance trend typically makes triangle breakouts on tokens like M less likely to hold.
Its ETH correlation, in practical terms, means broad risk sentiment across the larger smart-contract platforms tends to show up in M's price shortly after, especially during a low-volume compression phase like the one visible on both charts right now.
Neither relationship is quantified with a precise coefficient in this update that would require a dedicated correlation dataset beyond what's covered here.
Risks and What Would Invalidate This Analysis
False breakout risk: Price is sitting almost exactly on the apex of both the 4H and 1D patterns. A wick beyond either boundary without a full close is a strong candidate for a false signal, not confirmation.
Liquidity risk: Total tracked 24h futures volume across all listed exchanges is well under $20M. On a token this thinly traded, a large single order can move the price further and faster than the same order would on a deeper market.
Supply overhang risk: Only about 13% of MemeCore's 10B max supply is currently circulating. Future token unlocks are a standing risk for any long-term price target and aren't reflected in the current chart-based levels.
Macro dependency: A sharp BTC or ETH move can override this setup entirely, particularly given how tight both timeframes' patterns currently are.
Data staleness: Every level here is tied to the July 20, 2026, chart snapshot. If MemeCore has already closed beyond $1.5409, $1.0124, $1.5461, or $0.8936 since publication, treat the scenario table as historical rather than current.
This is not financial advice. These are conditional technical scenarios, not guaranteed outcomes, and MemeCore carries the added volatility typical of lower-cap, lower-liquidity tokens.
Final Outlook
MemeCore sitting almost exactly on the apex of a 4H symmetrical triangle while pressing into the flat resistance of a daily ascending triangle at the same time is about as tight a compression as a chart gets.
The short-heavy liquidation data over the past day suggests the path of least resistance has leaned upward recently, but that alone isn't confirmation; a genuine breakout still needs a confirmed close above $1.5409 short-term or $1.5461 long-term.
Until that happens, $1.0124 down to $0.6978 remains the zone to watch if the pattern resolves the other way instead.
Given how thin trading volume is here relative to larger tokens, whichever side confirms first is likely to move fast.
Worth tracking MemeCore whale activity near either boundary for an earlier read.
Glossary
Symmetrical triangle highs and lows converging toward the same point, typically signaling an approaching breakout without confirming which direction in advance.
Ascending Triangle: a rising trendline of higher lows underneath, pressed against a flat horizontal resistance line above. Leans bullish more often than not, but only once resistance actually breaks.
A resistance level is a price ceiling that has capped rallies previously; a support zone is the floor that has stopped declines previously.
The liquidation heatmap shows where leveraged positions are being force-closed and which side is under heavier pressure. Exchange volume is the total trading activity for a token, tallied across every exchange it trades on.
BTC dominance measures Bitcoin's share of total crypto market capitalization. ETH correlation describes how closely a token's price tends to move alongside Ethereum's.
Methodology
Chart levels in this MemeCore price prediction come from manually reviewed 4H and 1D charts, cross-checked candle-by-candle against the source screenshots.
No level here is extrapolated beyond what the chart shows. Liquidation and exchange volume figures are sourced from the Coinglass derivatives dashboard for the same 24-hour window as the chart snapshot.
The reward-to-risk table is a simple price-distance calculation, not a probability model. No verified social sentiment or on-chain whale-activity source was available for this update, so those claims are intentionally omitted rather than inferred.
This analysis reflects a snapshot as of July 20, 2026; all price, volume, and liquidation figures should be reverified before republishing, and any chart level already broken by the time of reading should be treated as historical context rather than a live signal.
This is not financial advice.
Disclaimer: This article is informational commentary based on publicly available market data. It is not financial, investment, or trading advice, and the author is not a licensed financial advisor. Cryptocurrency prices are volatile and can move sharply within hours. Verify all figures against a live source and consult a licensed professional before making financial decisions.
Also read:
















