Official Trump Price Prediction 2026-2031: Long-Term Forecast


$TRUMP is sitting around $1.63 right now, and after a drawdown this brutal, most people have stopped paying attention to the token altogether.
But the monthly chart is finally pressing into a level it hasn't touched in over a year, and that's reason enough to actually sit down and work through where this official Trump price prediction 2026-2031 outlook could realistically go.
Where Is Official Trump Price Right Now?
TRUMP/USD is trading at $1.6255 on the monthly chart, based on Bitstamp pricing. This month opened at $1.6583, pushed up to a high of $1.8721, then got sold right back down to $1.5681 before settling near current levels.
That puts the month down 1.87%, which sounds small until you zoom out. TRUMP is still about 98% off its all-time high.
That's the kind of number that scares most people off completely. But price behavior right here, at this exact level, is telling a slightly different story than the one the headline drawdown suggests.
Is Official Trump Finally Testing Its Descending Monthly Trendline?
Since the early highs, $TRUMP has been trading inside a descending trendline that's held for month after month, price falling from well above $8, grinding through the $3 zone, and eventually landing where it sits today.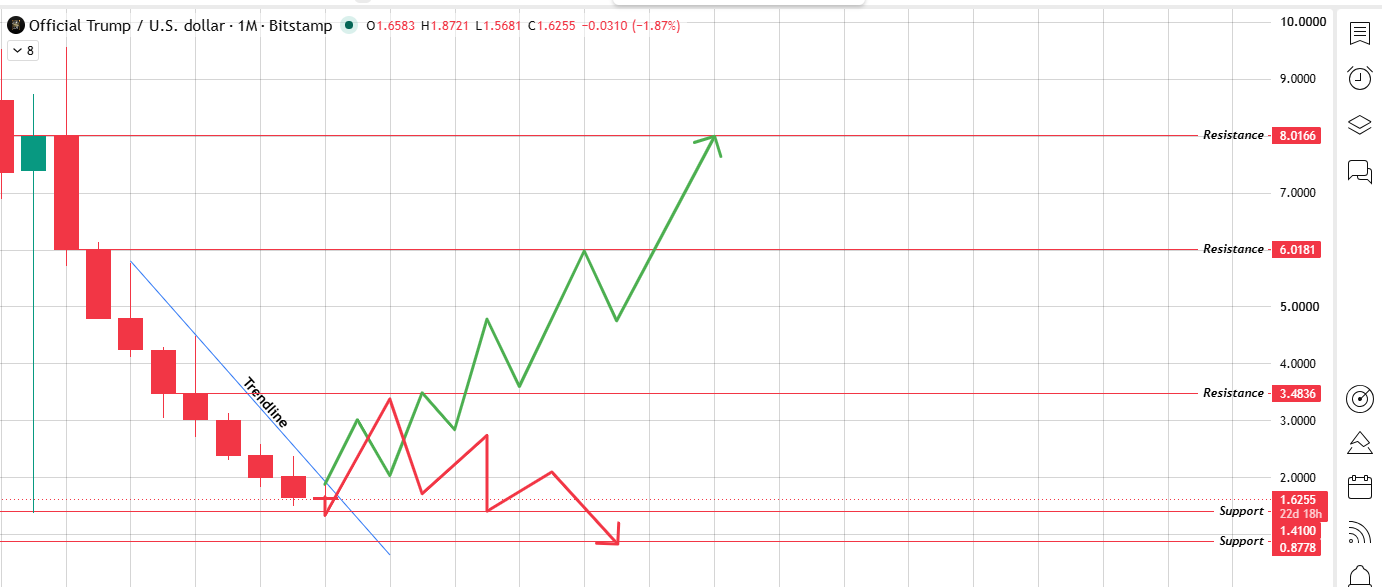
Source: Chart Taken From TradingView
Right now, price is pressing directly into that trendline for the first time since the downtrend started, sitting almost exactly on it around the $1.60 to $1.65 zone.
It hasn't broken through yet; this is a test, not a confirmed break, but it's the closest TRUMP has gotten to challenging that line since it first formed.
That distinction matters. A monthly close above this trendline would carry a lot more weight than the same move on a daily or weekly chart, because it takes sustained buying pressure across multiple full months to actually pull off, not just a few strong days.
Until that close happens, the downtrend is technically still intact.
What Does Market Sentiment Show?
For context, $TRUMP launched back in January 2025 as an official meme coin tied to Donald Trump, running on Solana, sitting inside the PolitiFi category that mixes political branding with crypto speculation.
It's not purely a speculative chip either; holders get tied into things like the $Trump Billionaires Club game, and higher-tier holders get access to real-world events.
The all-time high was $73.43, hit early in the token's life, and it's been mostly downhill since.
Right now, community sentiment on trackers like CoinGecko still reads bearish, which makes sense given how far off the highs the price still sits.
But here's the part people tend to miss: 24-hour trading volume has jumped noticeably, up well over 25% day over day.
That kind of volume spike doesn't always mean much on its own, but it tends to show up right before a trend shift more often than it shows up during a dead market. Worth watching, not worth betting the farm on.
Official Trump Price Prediction 2026: Where Does TRUMP Go From Here?
Price is parked right on the $1.6255 support zone, and it's testing the descending trendline directly above it, so the next couple of monthly closes are going to matter a lot for where this goes in the short term.
If TRUMP manages a clean close above the trendline and holds the $1.6255 zone as support, the first real fight happens at $3.4836.
That level isn't random; $TRUMP spent real time trading through that exact zone on the way down, so expect it to put up resistance on the way back up too.
Fail the trendline test instead, or lose the $1.41 zone below, and this whole setup starts looking a lot weaker. A slide back toward $0.88, which sits close to the token's all-time low, becomes the more likely path for the rest of 2026 if that happens.
What Could Drive Official Trump Toward 2027 and 2028?
Political meme coins don't run on halvings or protocol upgrades; they run on attention. That's the honest truth about this category.
A fresh news cycle, a high-profile endorsement, or a broader rotation of capital back into political tokens could be enough to reignite the kind of demand that took this thing to $73 in the first place.
If the trendline eventually breaks and $3.4836 gets cleared, the next real test sits at $6.0181.
Getting there would put TRUMP back at levels it hasn't seen in a long time, and it would almost certainly need both a friendlier crypto market overall and a real spark of attention around the token itself, not just chart mechanics.
Official Trump Price Prediction 2029 to 2031
This far out, the chart stops being the main driver. What matters more is whether $TRUMP still means anything as a brand by then.
A full recovery scenario here means eventually clearing $6.0181 and testing $8.0166, which would basically undo the entire downtrend that's been running since the 2025 peak.
That's not a crazy outcome if political meme coins see a real comeback during this stretch and $TRUMP holds its spot as one of the more recognizable names in the space.
It's just as possible, though, that Price spends most of these years chopping between $1.50 and $3.50 with no clean breakout either way.
That happens to a lot of tokens once the initial hype cycle fades and nothing new comes along to replace it.
Official Trump Price Prediction 2026 to 2031: Target Table
Here's a rough year-by-year range based on extending the current monthly structure.
This is scenario mapping, not a forecast to trade off of.
| Year | Bear Case | Base Case | Bull Case |
|---|---|---|---|
| 2026 | $0.88 | $1.63 – $3.48 | $3.48+ |
| 2027 | $1.00 | $2.50 – $4.50 | $6.02 |
| 2028 | $1.20 | $3.50 – $6.02 | $7.50 |
| 2029 | $1.40 | $4.50 – $7.00 | $8.02 |
| 2030 | $1.60 | $5.00 – $7.50 | $9.00+ |
| 2031 | $1.80 | $5.50 – $8.02 | $10.00+ |
The base case assumes the trendline test eventually resolves upward and price grinds through resistance over several years.
The bull case leans on a real resurgence in political attention around the token, plus a broader crypto market that's in a risk-on mood.
The bear case assumes the trendline test fails and TRUMP drifts back toward its lower range with no fresh catalyst.
Official Trump Price Prediction: What's Next in the Near Term?
The descending trendline that's held since the 2025 crash hasn't broken yet, but the price is testing it directly, sitting right at the $1.6255 zone for the first time in this entire downtrend.
A clean monthly close above the trendline and the recent $1.87 high, followed by a push through $3.4836, would be the strongest confirmation yet that this isn't just another dead-cat bounce.
For now, this official Trump price prediction for 2026 to 2031 leans cautiously watchful rather than confidently bullish.
The setup is interesting because price is finally challenging a line it's respected for over a year, but nothing is confirmed until that monthly close actually happens. The next candle or two will do most of the talking.
Final View
$TRUMP is a political meme coin first, so it can move faster than any chart level suggests.
Price is finally testing a trendline it respected for over a year, worth watching, but still just one data point, not a confirmed reversal.
Treat 2026 to 2031 as a range of outcomes, not a fixed target, and watch whether monthly candles hold above $1.6255.
Disclaimer: This article is for informational purposes only and does not constitute financial, investment, or trading advice. Cryptocurrency markets are highly volatile and speculative. All price levels and scenarios discussed are based on chart analysis and publicly available data and are not guarantees of future performance. Always do your own research and consult a licensed financial advisor before making any investment decisions.
Also read:












.webp)




