Official Trump Price Prediction 2040: Can $TRUMP Climb Back to $8?

The official Trump price prediction 2040 is one of those searches that mean something different depending on who's asking.
This is a token still down roughly 97% from where it launched, sitting near $1.66 on the monthly chart while pressing against a trendline that's been falling since last September.
A quick reality check before anything else: $TRUMP isn't a policy or a company; it's a Solana-based token, and this breakdown sticks strictly to the chart and the publicly available token data rather than anything political.
Where $TRUMP Is Trading Right Now
Based on the monthly candle, TRUMP is sitting around $1.6571, up a fraction (+0.04%) this month, after opening at $1.6583 and swinging between a high of $1.8721 and a low of $1.6266.
That's a tight, low-momentum range compared to the sharp declines earlier in the chart, which is usually a sign a token is losing downside speed even if it hasn't turned upward yet.
A Quick Fact Check on What $TRUMP Actually Is
The token launched in January 2025, just before a presidential inauguration, on the Solana network.
Public market-data trackers report that the initial release totaled 1 billion tokens, with only 200 million distributed publicly at launch; the remaining supply sat with two affiliated entities, CIC Digital LLC and Fight Fight Fight LLC, on a multi-year release schedule.
Nansen blockchain data cited by several trackers shows a wide split in outcomes among holders.
Early buyers near launch reportedly captured large gains, while a much larger group of later buyers has been sitting on losses since.
That split is worth knowing before treating any long-range chart target as a sure thing; this has historically been a high-volatility, unevenly distributed asset.
There's genuine public debate reported by outlets like Reuters over the conflict-of-interest questions raised by a sitting president's family holding a large stake in a token like this.
That's a real, ongoing conversation, and it sits alongside (not instead of) the purely technical read below.
Reading the Chart: Trendline, Support, and Resistance
The dominant feature on this monthly chart is a descending trendline running from the September 2025 highs down to the current price, with a series of lower highs stamped along the way. 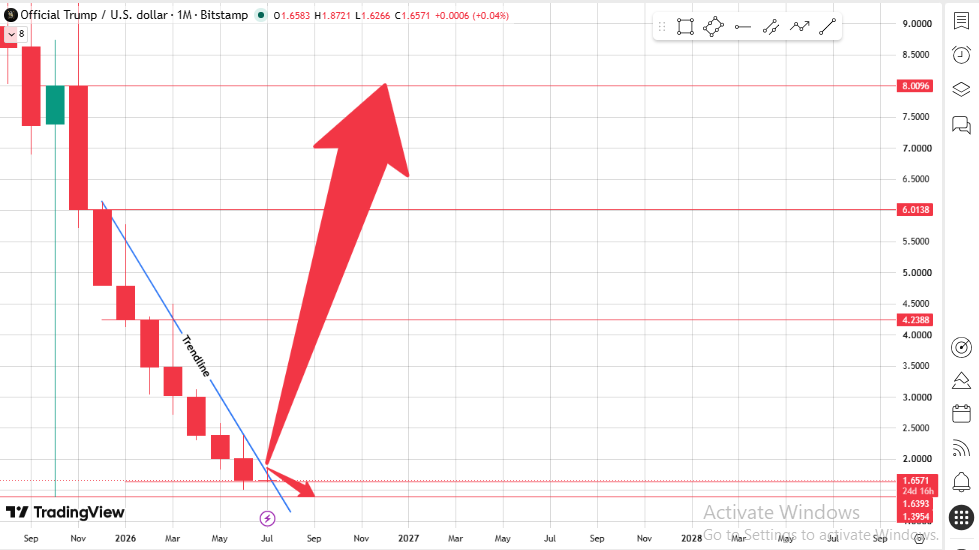
Source: Chart Taken By TradingView
The current candle is sitting right at that trendline, testing it from below after a long slide.
Resistance above current price:
-
$4.2388 is the first real ceiling, several multiples above where price sits now
-
$6.0138 mid-level resistance, roughly where the trendline itself intersects further out
-
$8.0096 is the level that would mark a genuine trend reversal rather than a bounce
Support below current price:
-
$1.6393 is the level defending the current base
-
$1.3954 is the deeper floor; losing this puts price at a fresh multi-month low
For context, clearing even the first resistance would mean the price roughly 2.5x-ing from here, a large move that would need real, sustained volume behind it rather than a single spike.
Long-Term Outlook Through 2040
TRUMP's long-term price story has less to do with any single chart pattern and more to do with three things:
Whether the remaining locked supply gets absorbed by the market without crushing price as it unlocks, whether political meme coins as a category stay relevant a decade from now, and whether broader crypto cycles keep bringing fresh capital into speculative assets generally.
Official Trump Price Prediction 2040 Scenarios
| Scenario | 2040 Target | Catalyst Needed |
|---|---|---|
| Bearish | $1.1000 | Continued supply unlocks outweigh demand as the category loses relevance. |
| Base | $6.0138 | The trendline breaks with a gradual recovery across multiple market cycles. |
| Bullish | $8.0096 | Sustained buying volume clears all three major resistance levels during a strong bull cycle. |
$TRUMP Price Target Table: 2027-2040
| Year | Bear Case | Base Case | Bull Case |
|---|---|---|---|
| 2027 | $1.3954 | $1.9000 | $4.2388 |
| 2030 | $1.3000 | $3.2000 | $6.0138 |
| 2035 | $1.2000 | $4.8000 | $7.2000 |
| 2040 | $1.1000 | $6.0138 | $8.0096 |
The bear case assumes locked supply keeps unlocking faster than fresh demand shows up, gradually pressuring prices lower each period.
The base case tracks a slow grind through the descending trendline and each resistance band over successive cycles.
The bull case assumes sustained volume clears $4.2388, then $6.0138, then $8.0096 roughly a cycle apart; none of it happens overnight.
Three Scenarios Worth Watching
Worst case: Locked supply continues unlocking faster than new demand arrives, the $1.6393 support fails, and price grinds down toward $1.3954 with the category losing broader attention over time.
Base case: Price holds its current range, slowly works through the descending trendline over multiple cycles, and settles somewhere in the $4–$6 range by the 2030s as the token finds a lower, steadier equilibrium.
Best case: A renewed wave of interest in political and PolitiFi-themed tokens combines with a strong broader crypto cycle, pushing TRUMP through all three resistances toward the $8+ zone by 2040.
Official Trump Price Prediction 2040 Scenarios
| Scenario | Price Range | Trigger |
|---|---|---|
| Worst Case | $1.20 – $1.40 | Supply unlocks outpace demand, creating a sector-wide risk-off environment. |
| Base Case | $4.20 – $6.01 | Gradual multi-cycle recovery above the long-term descending trendline. |
| Best Case | $6.01 – $8.01+ | Renewed PolitiFi demand combined with a strong crypto bull market. |
Key Levels to Watch
Resistance zone: $4.2388 to $8.0096, the three ceilings between here and a full trend reversal.
Support zone: $1.3954 to $1.6393, the base that's kept the current range intact after a long decline.
Invalidation: a clean break below $1.3954 would mark a fresh low and put any recovery case on hold.
Bottom Line
TRUMP is sitting at a relatively quiet point on its chart after a long, steep decline from its January 2025 peak, testing a descending trendline rather than confirming a reversal.
The token's structure is unusual for the category: a large share of supply still locked with entities affiliated with the project, a well-documented gap between early and later buyers' outcomes, and an ongoing public conversation about the conflicts of interest involved.
None of that is a reason to assume the chart targets above will or won't happen; it's context worth having before treating any single number as a forecast.
The $1.6393 support is the level worth watching most closely. Hold it, and the current base stays intact. Lose it, and the next stop is the deeper floor at $1.3954.
Disclaimer: This article is for informational and educational purposes only and does not constitute financial, investment, or political advice. Cryptocurrency markets are highly volatile, meme tokens carry an elevated risk of loss, and price predictions are speculative by nature. Always conduct independent research and consult a qualified financial advisor before making any investment decisions.