Pi Network Price Prediction: PI Bulls Face 775.8M Token Unlock Test


This pi network price prediction starts with where things stand today: PI is down 10.3% today, trading at $0.08232.
Rough week, no way around it. It's a steep comedown from where this token started. PI hit an all-time high of $3.00 back in February 2025.
When it first opened to exchanges after years of mobile mining since the app's 2019 launch, and today's price sits over 97% below that peak.
There's also a fresh supply story developing: nearly 775.8 million PI tokens are scheduled to unlock over the next few months, running through to the end of 2026.
Full breakdown below, including a holder concentration detail that's worth knowing before reading too much into any of this.
PI Price Snapshot (July 24, 2026)
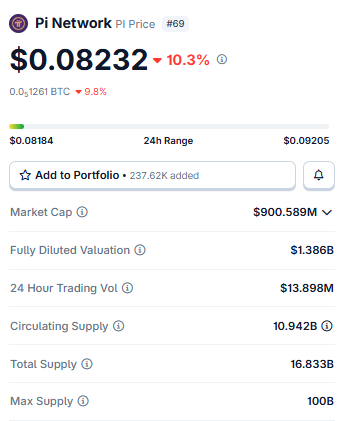
Source: Data Taken From Coingecko, data as of July 24, 2026. Figures may vary slightly across other tracking websites.
Worth sitting with that supply table for a second. Circulating supply is only about 65% of total supply, and total supply itself is barely a sixth of the eventual 100 billion max.
That gap is exactly why the unlock schedule below matters as much as the chart does.
Holder Concentration: A Number Pioneers Should Know
Here's something that doesn't show up on a candlestick chart but probably should.
On-chain holder data reviewed for this piece shows a tracked set of eight wallet addresses holding 500 million PI between them and one single address controls 494,604,514 of that, which works out to 98.9% of the tracked total. 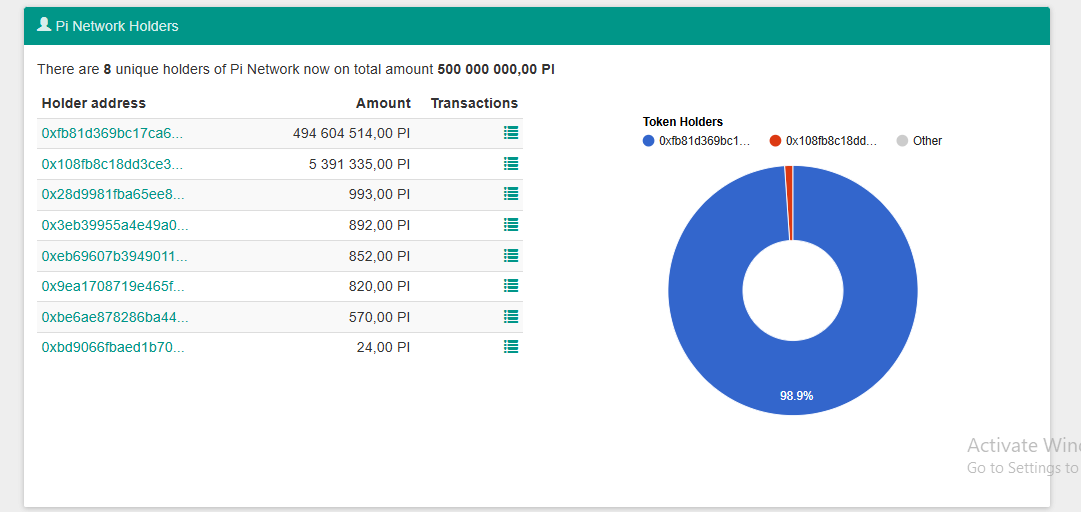
Source: Holder Data Taken From Bloxy.
The next-largest address holds just over 5.39 million PI, and everything past that drops into the hundreds.
A couple of honest caveats here: this 500 million $PI figure is a specific tracked holder set, not the full 10.942 billion circulating supply, and concentrated top addresses often turn out to be exchange wallets, bridge contracts, or foundation reserves rather than a single trader's private bag.
Still, this kind of lopsided whale concentration is worth flagging.
It means a huge share of tracked supply sits in very few hands, and moves from an address like that can shift price and liquidity fast if it ever becomes active.
Token Unlock News: 775.8 Million PI Incoming
The other story shaping sentiment right now is supply, not price action.
$Pi Network is set to release close to 775.8 million PI tokens over the next several months, with the schedule running through the end of 2026, based on data pulled from PiScan and reported by crypto news accounts this week. 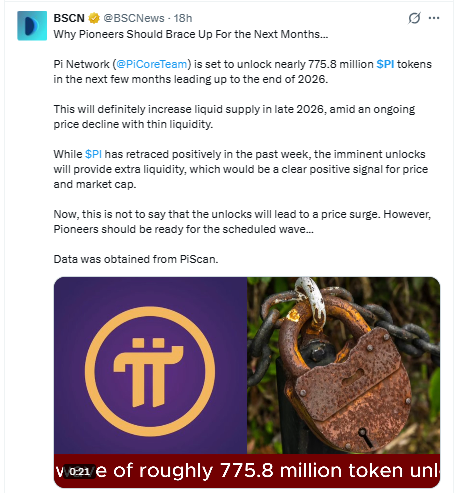
Source: Data Taken From @BSCN, X Account.
That's a meaningful add to liquid supply at a time when price is already under pressure.
The framing worth borrowing here: a token unlock on this scale isn't automatically bearish.
More liquid supply hitting exchanges can just as easily be read as a positive if it improves depth and trading conditions, especially with PI having posted a modest positive retrace over the past week heading into the news.
It's not a guaranteed price surge either way; it's a supply event, and Pioneers holding PI should treat it as a scheduled variable to watch rather than a verdict on where price goes next.
4-Hour Chart: Rising Trendline Fighting the Bigger Downtrend
The 4H picture adds a layer of nuance. $PI closed at $0.08256, down 1.07% on the candle, and the price is currently riding a rising trendline built off the recent swing low.
That trendline is the short-term bulls' best friend right now; as long as it holds, dips keep getting bought.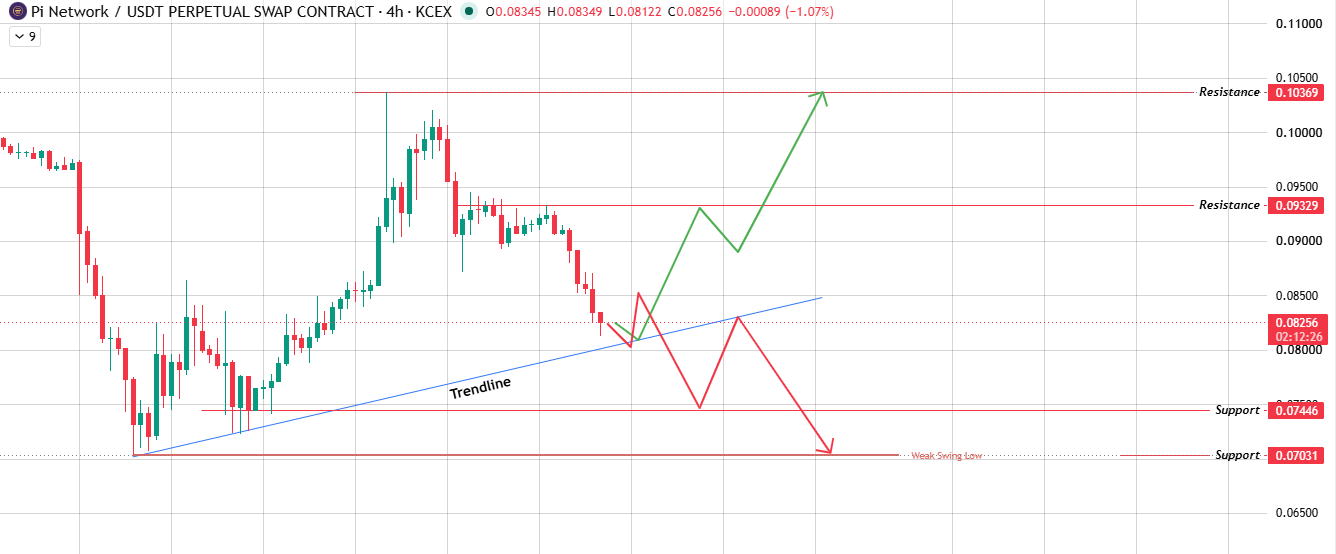
Source: Chart Taken From TradingView, 24-07-2026
Above price, resistance stacks at $0.09329 and then $0.10369.
A clean bullish breakout through both would put PI back in territory it hasn't traded at in a while.
Below, support sits at $0.07446, with a second, explicitly labeled "weak swing low" at $0.07031 chart language for a level that hasn't really been tested with conviction, meaning a break there could move quickly rather than grinding
1-Day Chart: A Symmetrical Triangle Right at the Decision Point
The daily candle closed at $0.08227, down 4.02% on the session, after tagging a high of $0.08704 and a low of $0.08122. Zoom out on the chart.
$PI has been squeezing into a symmetrical triangle, lower highs stacking down and higher lows stacking up, both boundaries converging toward roughly where price sits today.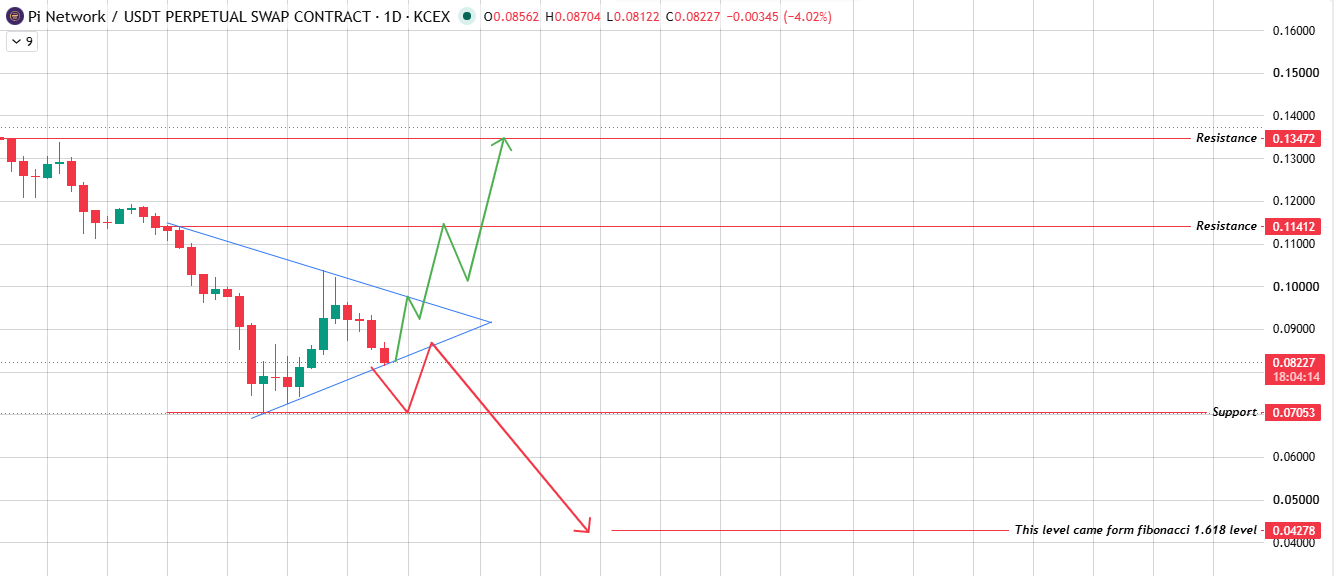
Source: Chart Taken From TradingView, 24-07-2026
Break out the top of that triangle, and the first stop is $0.11412, with $0.13472 as the next resistance level if momentum holds.
Break down instead, and the chart's marked support at $0.07053 gives way to something more serious: a level at $0.04278, tagged directly on the chart as coming from the fibonacci 1.618 level.
That's not a small move; it's roughly half of where PI sits today, so it's the kind of downside target that only matters if the triangle actually fails, not something to treat as a base case.
$PI Price Scenario Table
None of this happens in a vacuum. PI's relatively thin $13.898M daily volume against a $900M market cap means it's more sensitive to shifts in BTC dominance and broader risk appetite than a deeper-liquidity major would be.
When BTC and ETH are grinding sideways or under pressure, altcoins like PI with smaller trading books tend to see exaggerated moves in both directions, something worth weighing alongside the ETH correlation backdrop before sizing any position around these triangle levels.
Final Outlook
Two things are true about PI at the same time. The chart is genuinely balanced: a triangle on the daily and a rising trendline on the 4H, both structures that could resolve either way depending on which boundary gives first.
And the supply side is about to get more complicated, with 775.8 million tokens due to unlock into a market that's already down double-digits today.
The 98.9% concentration in the tracked holder set adds one more variable: if a wallet holding that much ever moves meaningfully, it could overwhelm whatever the chart is doing on its own.
For now, $0.07446 and the rising trendline are the lines in the sand for bulls, while $0.09329 and $0.10369 are what needs to break for this to turn into a real breakout story.
A loss of the triangle's lower boundary shifts the conversation toward that $0.04278 Fibonacci level fast.
Glossary
-
Symmetrical Triangle: Picture two lines squeezing price from both sides one sloping down, one sloping up. Eventually the price runs out of room and has to pick a direction, usually with some force behind it.
-
Rising Trendline: Connect the dots between higher lows, and you get this line. It works as support for as long as buyers keep stepping in near it the moment they stop, it breaks.
-
Token Unlock: When previously locked or vested tokens get released into circulating supply on a set schedule, usually laid out in a project's tokenomics plan from the start.
-
Fibonacci Extension: A tool traders use to guess how far a move might travel beyond where it already went, built off ratios like 1.618 that show up again and again in market structure.
Methodology
Every level in this piece triangle, boundaries, trendlines, and the support and resistance zones came straight off the PI/USDT 1D and 4H perpetual swap charts on KCEX, checked on July 24, 2026.
The holder concentration numbers reflect the specific tracked address set shown in the data, not PI's entire circulating supply, and that distinction matters, so it's called out rather than glossed over.
Unlock figures are pulled from PiScan reporting circulating this week. Nothing here goes beyond what the source charts and data actually show no guesswork, no filled-in gaps. One more thing worth saying plainly: this isn't financial advice.
PI trades thin and moves fast, and these levels can age quickly once new candles print.
Disclaimer: This article is for informational purposes only and is not financial advice. Cryptocurrency markets are volatile; do your own research before investing.
Also read:

















