Pi Network Price Prediction: Protocol v26 Meets, Double-Bottom Rally?


$Pi Network's official team is pushing node operators to complete the Protocol v26 upgrade by August 11.
Pi Network is a mobile-first cryptocurrency project aiming to make crypto mining accessible through everyday smartphones, according to its own project materials.
This Pi Network Price Prediction looks at whether $PI can build on this momentum over the next two to three weeks.
Here's what's driving the buzz and what the charts say next.
Pi Network Price Prediction Today: Market Overview
Metric | Value |
Price | $0.08553 |
24h Change | +2.96% |
Market Cap | $938.99M (+5.06%) |
24h Volume | $11.02M (+4.09%) |
Vol/Mkt Cap (24h) | 1.17% |
FDV | $8.54B |
Total Supply | 100B PI |
Max Supply | 100B $PI |
Circulating Supply | 10.99B $PI |
Source: Data from CoinMarketCap as of 1/08/2026. Figures may vary slightly across other tracking websites.
$Pi Network News: PI Tops Bullish Sentiment List
According to third-party reporting on CoinMarketCap's community sentiment data, $Pi Network currently leads the platform's most-bullish list with a 91.5% bullish rate, ahead of Worldcoin and Kaspa. 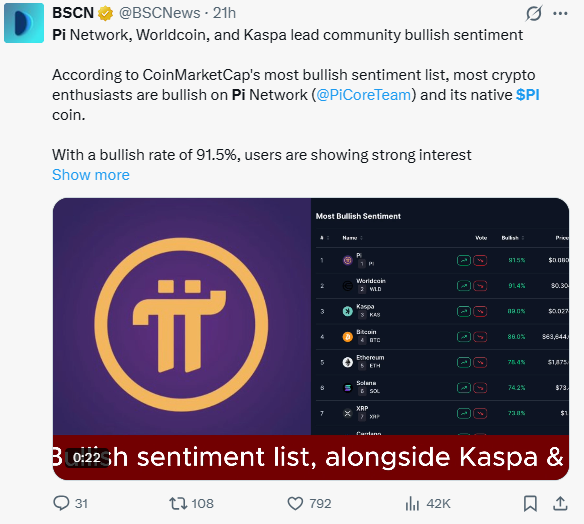
Source: Data From X
This is a sentiment poll reflecting community mood rather than an on-chain or fundamental metric, so it's worth noting as context around today's move rather than treating it as a price driver on its own.
$Pi Network Protocol v26 Upgrade: What's Changing
Pi Network's official team has confirmed the mainnet is upgrading to Protocol v26, with all node operators required to complete the upgrade by August 11 to remain connected to the network.
The upgrade is described as improving contract safety, state management, interoperability, and cryptographic capabilities, ahead of the final planned Protocol v27 upgrade.
This is a real, official network-level development, though it's a technical infrastructure upgrade rather than something that directly guarantees a price reaction.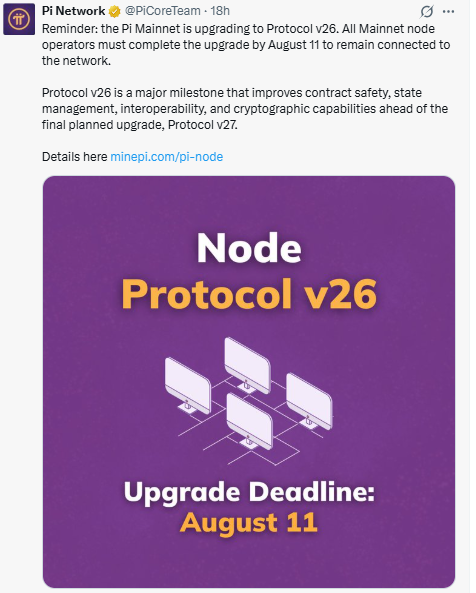
$Pi's own Mainnet Metrics dashboard shows migrated mining rewards of roughly 10.99 billion π, matching the circulating supply figure above. Of that, about 6.19 billion π remains locked, with roughly 4.80 billion π currently unlocked.
The effective total supply, calculated at R/65%, works out to about 16.91 billion π against a 100 billion π max supply—a reminder that a meaningful share of $Pi's circulating figure is still under lock-up terms rather than fully liquid.
PI Prediction Chart: Short-Term Technical Analysis
Pair: PI/USDT · Market: Spot (Crypto) · Exchange: OKX · Timeframe: 4H · Source: TradingView · Timestamp: August 1, 2026, 16:00 UTC+5:30
The 4H chart shows a developing inverse head-and-shoulders pattern: a left shoulder, a deeper head low near the $0.07265 zone, and a right shoulder forming higher before the latest candle pushed price up through the neckline near $0.08553.
$PI trades at $0.08553, right at that neckline level. The EMA 20 ($0.08248) EMA (exponential moving average) readings that weight recent candles more heavily than a simple average and the EMA 50 ($0.08266) both sit just below the current price, recently reclaimed.
RSI (14), the Relative Strength Index, a momentum indicator reading above 70 as overbought and below 30 as oversold, sits at an elevated 62.97, showing real momentum without being overbought yet.
The neckline break has just happened on this candle and hasn't been confirmed with a hold above it yet, so this pattern is a breakout in progress rather than a fully confirmed move.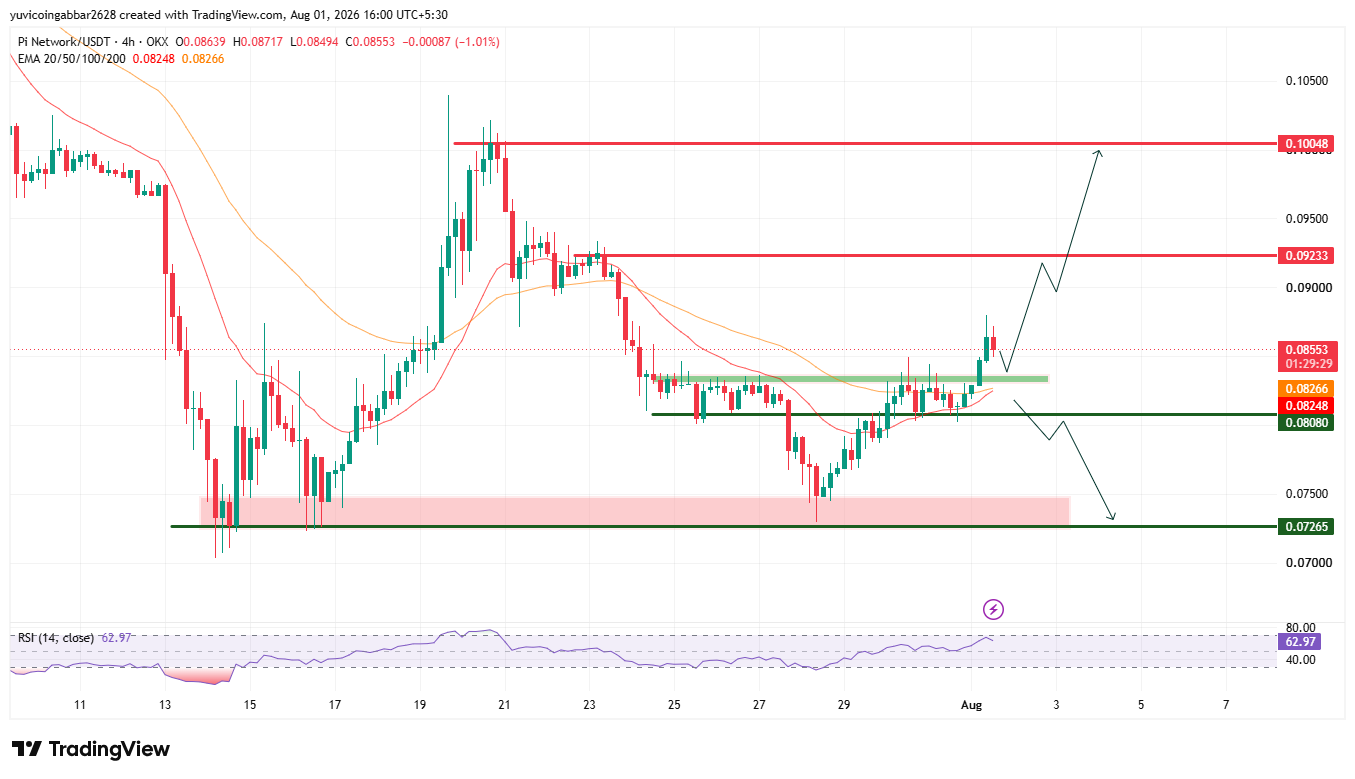
Level Type (Short-Term, 4H) | Price |
Resistance 2 | $0.10048 |
Resistance 1 | $0.09233 |
Immediate Price Reference / Neckline | $0.08553 |
Support Cluster (EMA 20 / EMA 50) | $0.08248 / $0.08266 |
First Support (neckline retest zone) | $0.08080 |
Deeper Support | $0.07265 |
PI Prediction Chart: Long-Term Technical Analysis
Pair: PI/USDT · Market: Spot (Crypto) · Exchange: OKX · Timeframe: 1D · Source: TradingView · Timestamp: August 1, 2026, 16:10 UTC+5:30
Zooming out, $PI is working on a potential double-bottom pattern that isn't confirmed yet: a first low formed near $0.07624 in mid-to-late July, followed by a bounce, a pullback, and what looks like a second low attempt now forming in the same zone.
The pattern would only be confirmed if the price breaks and holds above the $0.09604 resistance, which hasn't happened.
The EMA 20 ($0.08739) sits just above the current price, unreclaimed, and the EMA 50 ($0.10317) sits well above that. RSI (14) is neutral at 41.94.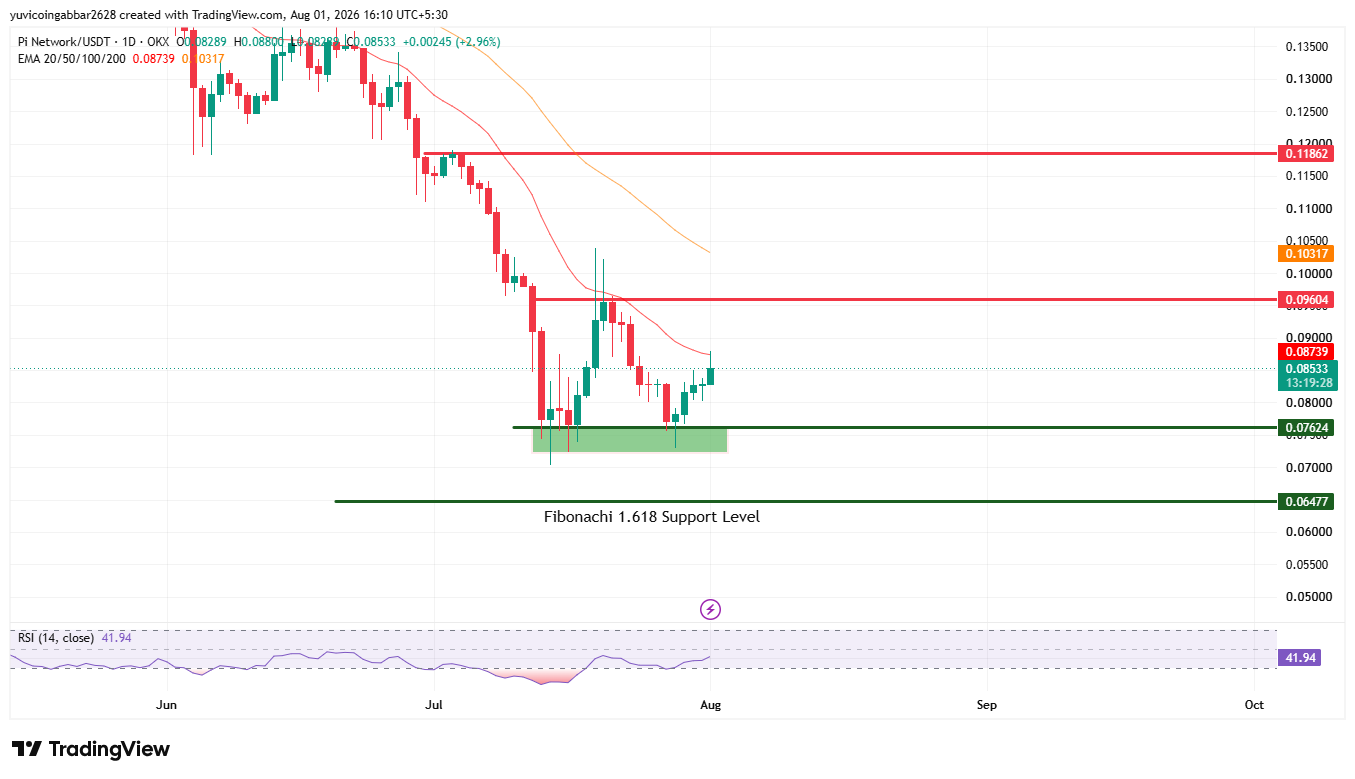
Level Type (Long-Term, 1D) | Price |
Resistance top | $0.11862 |
(EMA 50) | $0.10317 |
Resistance 1 (double-bottom neckline) | $0.09604 |
Initial Recovery Level (EMA 20) | $0.08739 |
First Support (double-bottom zone) | $0.07624 |
Deeper Support (Fibonacci 1.618 extension) | $0.06477 |
Pi Network Forecast: Bull Case vs. Bear Case
$PI price target bull case: The 4H inverse head-and-shoulders neckline breaks at the $0.08553 level, then $0.09233 first, then $0.10048 if momentum holds.
On the daily, a confirmed close above the double-bottom neckline at $0.09604 would validate that bigger pattern too, with the EMA 50 at $0.10317 as the next test, then $0.11862.
$PI price target bear case: A rejection back below the 4H EMA cluster ($0.08248–$0.08266) would put the forming inverse Head & Sholder breakout in question.
More importantly, losing the $0.07624 double-bottom zone on the daily would invalidate that pattern entirely, opening the $0.06477 Fibonacci 1.618 extension as the next level down.
Pi Network Price Prediction 2026: Can PI reach $0.11862?
A move to $0.11862 would be a stretch beyond the near-term bull case.
It would require $PI to first confirm the daily double-bottom neckline break at $0.09604, then clear the EMA 50 at $0.10317 and hold above it a multi-stage move where each resistance layer needs to break in sequence.
What Could Invalidate the Bullish Setup?
A rejection at the 4H EMA cluster ($0.08248–$0.08266), followed by a failure to hold the neckline retest zone at $0.08080, would put the short-term breakout attempt in question.
More significantly, a confirmed daily close below $0.07624 would invalidate the double-bottom pattern altogether, opening $0.06477 as the next major level down.
Pi Network Price Prediction Methodology
This forecast draws on multiple inputs rather than a single chart pattern: the short-term inverse head-and-shoulders setup, the long-term double-bottom structure, EMA positioning across both timeframes, RSI momentum, the Protocol v26 upgrade context, and community sentiment data.
No single input is treated as decisive on its own, and the CMC sentiment ranking is treated as mood context rather than a fundamental driver.
Pi Network Price Prediction: Expert View
According to CoinGabbar analysts, PI's chart is showing two constructive but unconfirmed patterns at once: a 4H inverse head-and-shoulders that's just cleared its neckline and a 1D double bottom that's still forming without having broken its own neckline yet.
RSI readings support this reading: elevated but not overbought on the short-term chart, neutral on the daily.
The Protocol v26 upgrade is a legitimate piece of network development, but it's an infrastructure deadline for node operators rather than something with a direct, mechanical link to price.
The real test remains whether $PI can hold above $0.08553 and eventually clear $0.09604 to confirm both patterns together.
Pi Network Price Prediction: Data Sources
Short-term price and RSI data referenced from a 4H PI/USDT chart on OKX via TradingView, timestamped August 1, 2026, 16:00 UTC+5:30. Long-term price and RSI data referenced from a 1D PI/USDT chart on OKX via TradingView, timestamped August 1, 2026, 16:10 UTC+5:30.
Market cap, volume, FDV, and supply data referenced from a CoinGecko-style market tracker, snapshot taken August 1, 2026.
Mainnet lock/unlock figures are referenced from $Pi Network's official Mainnet Metrics dashboard. The CMC bullish sentiment ranking is sourced from third-party reporting on CoinMarketCap data.
Disclaimer: This piece is for informational purposes only and isn't financial advice. Crypto prices are volatile, and it's worth doing independent research before acting on any of the levels discussed here.













.jpg)




