Pi Network Price Prediction: PI At A Critical Breakout Zone


Pi Network price prediction talk is picking up as PI quietly defends a level that already did its job once this week.
The lower liquidity has already been taken, and now the question is whether buyers can actually build on that or whether this turns into just another fakeout.
$PI Price Right Now
| Metric | Value |
| Price | $0.08159 |
| 24h Change | -0.9% |
| Market Cap | $893.23M |
| Volume (24h) | $7.54M |
| Circulating Supply | 10.94B PI |
| Total Supply | 100B PI |
| Max Supply | 100B PI |
Price and market data are pulled live from CoinMarketCap, with the chart read from the 4-hour PI/USDT contract on OKX via TradingView, as of July 27, 2026, 17:14 IST.
Why Is $PI Price Moving Today
$PI is down slightly over the past day, with 24-hour spot volume sitting at $7.54M against a market cap near $893.23M, a volume to market cap ratio of just 0.845%.
That's fairly thin turnover, which fits a market consolidating rather than trending hard in either direction.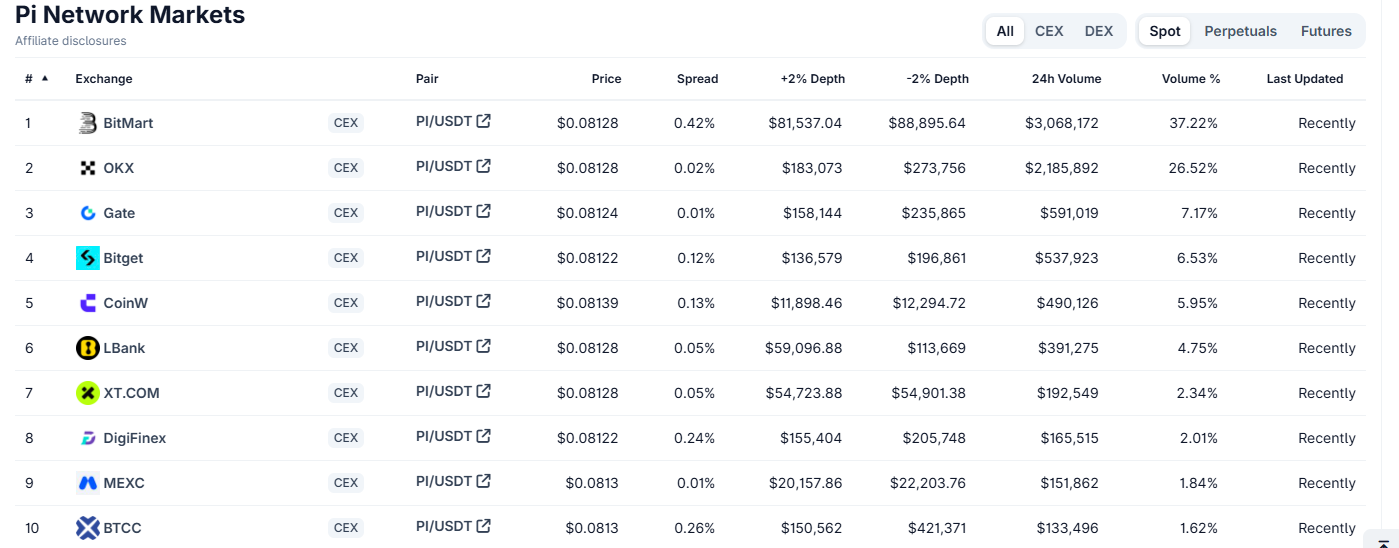
Liquidity across major venues like BitMart, OKX, and Gate remains tight, with spreads mostly under 0.5%, so the setup below is likely to move fast once one side actually commits.
Quick Take: PI is trading near $0.08159 on the 4-hour chart. A confirmed close above $0.08704 opens the path toward $0.09473 and $0.10211, while a close below $0.07989 shifts focus down to $0.07386 and $0.07008.
This is a 4-hour read and should be rechecked if the price closes decisively beyond either level.
$PI Technical Analysis: Trendline Hold After A Liquidity Sweep
$PI has been building a clean ascending trendline on the 4-hour chart, and price is currently sustaining right on top of it rather than breaking down. 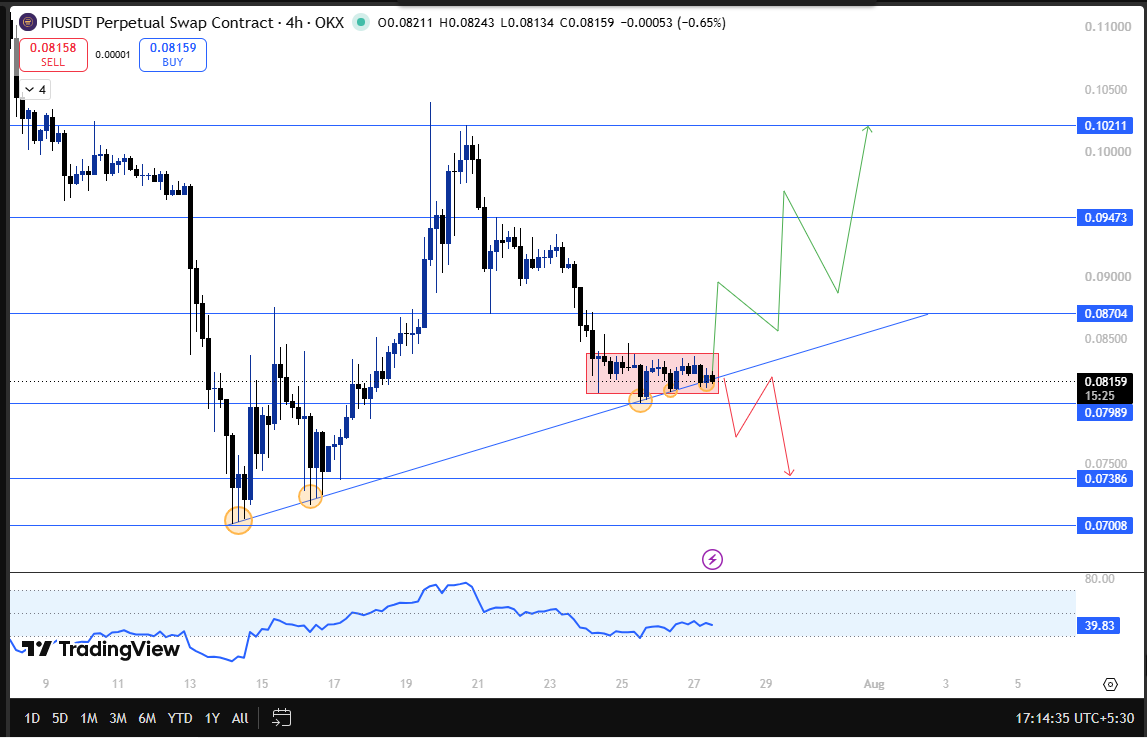
Before this hold, the lower liquidity sitting just below the trendline already got swept, which usually means the weak hands positioned for a breakdown have already been shaken out.
That kind of sweep followed by a reclaim of the trendline is generally read as a sign that sellers tried to push through and failed to hold the advantage, a setup our Pi Network make or break coverage also tracked closely.
If $PI breaks out above $0.08704 and closes a 4-hour candle above it, that would confirm the trendline hold was meaningful, opening the path toward $0.09473 next, with $0.10211 as a further target if momentum builds; a continuation flagged in our Pi Network rally is now an unstoppable piece.
On the downside, if $PI instead breaks $0.07989 and closes below it, that would undo the current trendline defense and open $0.07386 as the next support, with $0.07008 as the level after that, a scenario in line with the risk flagged in our $Pi Network 775M token unlock test analysis.
RSI on the 4-hour chart is sitting near 39.83, still on the cooler side after an earlier bearish divergence tag.
That level isn't oversold yet, but it does suggest momentum hasn't fully turned bullish either, which fits a market still deciding rather than one already breaking out.
$PI Glossary
-
Ascending Trendline: A rising support line connecting higher lows, used to track where buyers keep stepping back in.
-
Liquidity Sweep: A move through a support or resistance level that triggers resting stop orders just beyond it, often followed by a reversal.
-
RSI: A momentum indicator measuring how fast and how far price has moved, used to flag overbought, oversold, or divergence conditions.
$PI Support And Resistance Levels
| Type | Level |
| Resistance 2 | $0.10211 |
| Resistance 1 | $0.09473 |
| Breakout Trigger | $0.08704 |
| Current Price | $0.08159 |
| Support 1 | $0.07989 |
| Support 2 | $0.07386 |
| Support 3 | $0.07008 |
Risk Reward Table
| Case | Trigger | Target |
| Bull Case | 4h close above $0.08704 | Push toward $0.09473 and then $0.10211 |
| Bear Case | 4h close below $0.07989 | Drop toward $0.07386 and then $0.07008 |
Invalidation Level
This $PI trendline setup stays valid as long as price holds above $0.07989 on a 4-hour closing basis.
A confirmed close below that undoes the sweep-and-hold pattern and shifts focus to $0.07386 and then $0.07008.
A close above $0.08704 instead confirms the hold was real, supporting a move toward $0.09473 and then $0.10211, a scenario also outlined in thisPi Network 2026 technical chart outlook.
Expert View
Traders following this $Pi Network price prediction note that a lower liquidity sweep followed by a sustained trendline hold is typically a constructive signal, since it suggests sellers already tried and failed to break structure.
Thin 24-hour volume relative to market cap means the next confirmed close, in either direction, is likely to carry real weight for where PI heads next.
Full chart context is available on TradingView.