Pi Network Price Prediction: Is This Pullback a Buying Chance?


This pi network price prediction starts with where $PI stands today: down sharply, testing a zone it hasn't visited in a while.
Compared to other lower-cap coins going through similar pullbacks after a fast run-up, $PI drop looks more like a retracement than an outright breakdown, at least for now.
Hold the current zone, and a bounce-back toward recent highs is realistic. Lose it, and there's likely more room to fall before buyers step back in with any real conviction.
$PI Network Price Snapshot
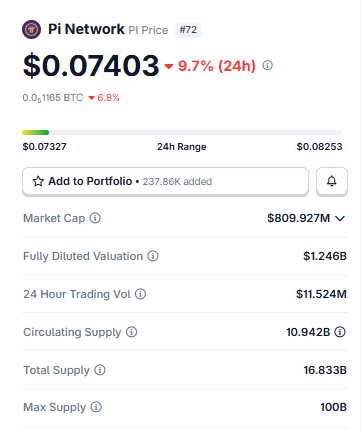
Source: PI Network Market Cap Data Taken From Coingecko, data as of July 28, 2026. Figures may vary slightly across other tracking websites.
Holder Concentration
Pi Network Holder concentration on the tracked $PI pool is stark. Just 8 wallets hold the entire tracked supply, and one address alone controls 98.9% of it. 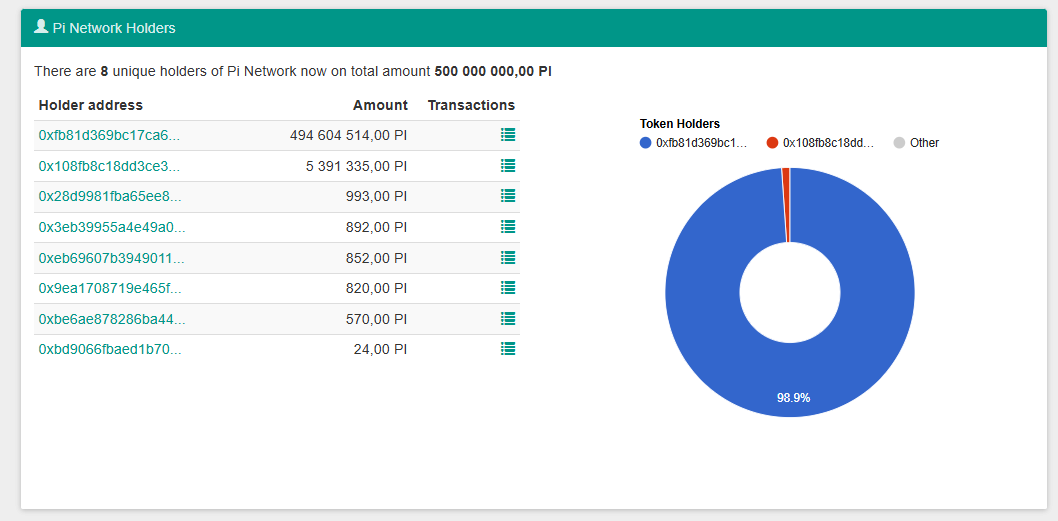
Source: Holder Data Taken From Bloxy.
Worth flagging clearly here, this reflects a specific tracked contract or pool, not the full pioneer base across Pi Network's wider mainnet, which counts holders in the millions.
Still, when a single data source shows this kind of skew, it's a decent reminder to treat any single-wallet-driven move with a bit of caution.
Social Sentiment: Pi Network Ecosystem News
Away from the charts for a second, there's real pi network news worth noting. $Pi Network Ventures just joined a $12 million seed round backing Axis Robotics.
A startup is building a data engine for Physical AI, simulation, real-world data capture, and human feedback combined to generate robotics datasets at scale. 
Source: Data Taken From @BscNews, X Account.
Hack VC, Nomad Capital, and a handful of angel investors joined the round too, and it's being framed as a step toward accelerating a global human-in-the-loop data pipeline.
Why does this matter for a pi network price prediction?
Because it signals the ecosystem is actually trying to build utility beyond just the token trading on exchanges, even if it won't move the short-term price much on its own.
4H Chart: Pi Network Price Prediction Levels
$PI has been sliding down a trendline since its last swing high on 19 july near $0.1037, and price is testing a familiar zone right now, the Fibonacci 1.0 retracement at $0.07266.
Same spot the last swing started from, so it carries some weight as a support zone. 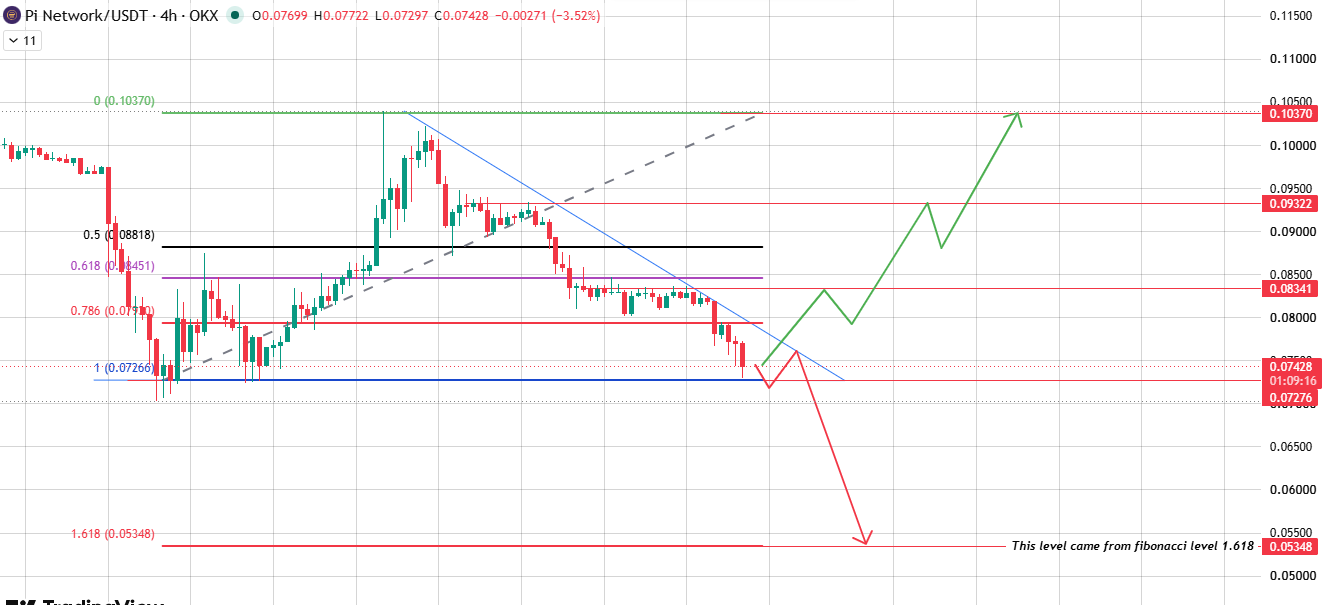
Source: Chart Taken From TradingView.
Hold it, and a breakout back through the $0.08341-$0.08500 area can open the door toward $0.09322, then the prior high near $0.1037 if momentum actually returns.
Break down instead, and the next real level is a step one, $0.05348, a fibonacci extension pulled from the chart itself, not guesswork.
Three-Scenario Outlook
-
PI sits near $0.07403 right now, down 9.7% today and well off its recent swing high.
-
This pi network price prediction really comes down to one Fibonacci support zone; hold it or lose it.
-
Holder data shows extreme concentration in the tracked pool. Worth a grain of salt.
-
$Pi Network's venture arm just backed an AI robotics startup, a sign the ecosystem's reaching beyond the token itself.
BTC Dominance and ETH Correlation
BTC dominance has held in the mid-to-high 50% range through July 2026, keeping a lid on broader rotation into smaller-cap altcoins like $PI.
Its ETH correlation isn't as tight as some majors, honestly. $PI still trades somewhat on its own news cycle given how young and community-driven the project remains.
A rough patch for the wider altcoin market tends to weigh on it too, just with more independent swings mixed in.
Final Outlook
$PI is testing an important Fibonacci support zone right now, and this pi network price prediction really hinges on whether that zone holds.
Reclaim $0.07428 with volume, and the broader pi-network rally case stays alive toward $0.09322 and beyond.
A clean break below $0.07266 opens a path down to $0.05348 instead. With ecosystem news like the Axis Robotics backing adding a longer-term utility angle, this setup leans toward patience over panic, at least until one of these levels actually gives way.
Glossary
Trendline: A line connecting a series of highs or lows on a chart. Shows which way the price has generally been leaning.
Fibonacci Extension: A level projected beyond a prior price swing, used to guess how far a move might travel once it pushes past its starting range.
Support Zone: A price area buyers have defended before, sometimes lining up with a technical level like a fibonacci retracement.
Resistance Level: Basically the flip side of support. A zone where sellers have capped gains in the past.
Holder Concentration: How much of a tracked token supply sits with a small number of wallets versus being spread out widely.
Methodology
Price levels here are pulled directly from the 4H chart referenced at the time of writing, including the fibonacci retracement and extension levels marked on it, nothing extrapolated beyond what's visible.
Liquidation and exchange volume heatmap data weren't available for this update, so they've been left out rather than estimated.
This article does not constitute financial advice.