Pi Network Price Prediction: Breakout or Fakeout After the Bounce?


This pi network price prediction picks up right where the last few weeks left off: $PI stuck in a slow bleed lower, until it wasn't.
Price just broke above the descending channel it had been sliding down for weeks, and it's now sitting near the upper end of its 24-hour range.
Compared to how PI has traded for most of this month, this move actually has some volume behind it, not just a wick that fades within the hour.
That doesn't make the breakout safe, though. It just means it's worth taking seriously.
Hold the zone it just broke above, and there's real room to run. Get rejected here instead, and this whole move could look like a fakeout within a day or two.
$PI Network Price Snapshot
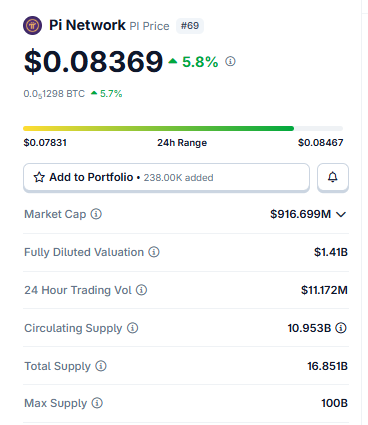
Source: Pi Network market data taken from CoinGecko, as of writing. Figures may vary slightly across other tracking websites.
Worth flagging early: circulating supply is barely 11% of PI's eventual 100B max supply.
That gap between what's trading now and what's still to come is one of the bigger structural things hanging over any pi network price prediction that stretches past just this week.
Social Sentiment: Pi Network Ecosystem News
Away from the charts for a second, Pi Network just detailed its Launchpad model for project token launches.
Proceeds from new project tokens go straight into a liquidity pool alongside Pi itself, the idea being to bootstrap liquidity rather than just let new tokens launch cold.
Source: Data Taken From @crpytodotnews, X Account.
The network also just completed its second test token distribution and opened up the post-launch interface and liquidity pools for people to explore.
Why does this matter for a pi network price prediction?
Because it's a sign the team is actually trying to give PI some use beyond just sitting on exchange order books, even if none of this moves the price by itself in the next 24 hours.
4H Chart: Pi Network Price Prediction Levels
The 4-hour chart on OKX tells most of the short-term story here. $PI spent weeks grinding lower inside a clean descending channel, and it just broke above the upper boundary of that channel. 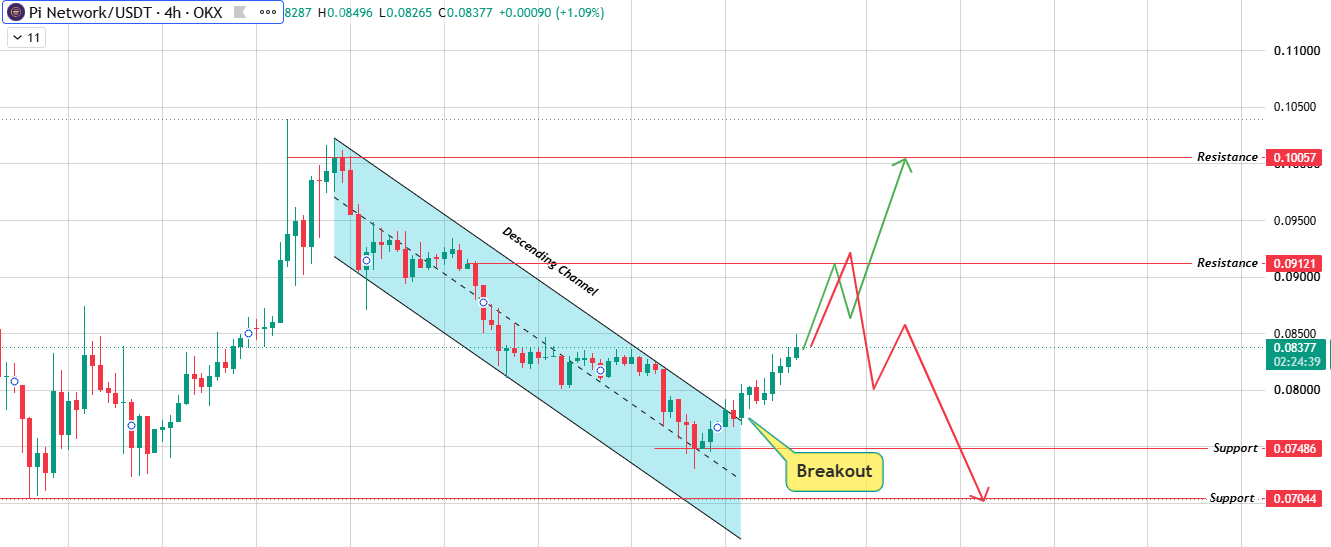
Source: Chart Taken From TradingView.
That breakout is really the whole story on this timeframe right now. Hold it, and resistance overhead sits at $0.09121 first, then $0.10057 above that if buyers keep showing up.
But if sellers get active right at that resistance and push back hard, this breakout can fail just as fast as it happened, sending the price back down through $0.07486, with $0.07044 next if that support doesn't hold either.
Daily Chart: The Bigger Trendline Underneath
Zooming out, the daily chart shows $PI building a rising trendline, and the price is currently sitting a bit above it.
That trendline lines up close to the same $0.07044 zone flagged on the 4-hour chart, which makes it a level worth watching on both timeframes at once rather than just one.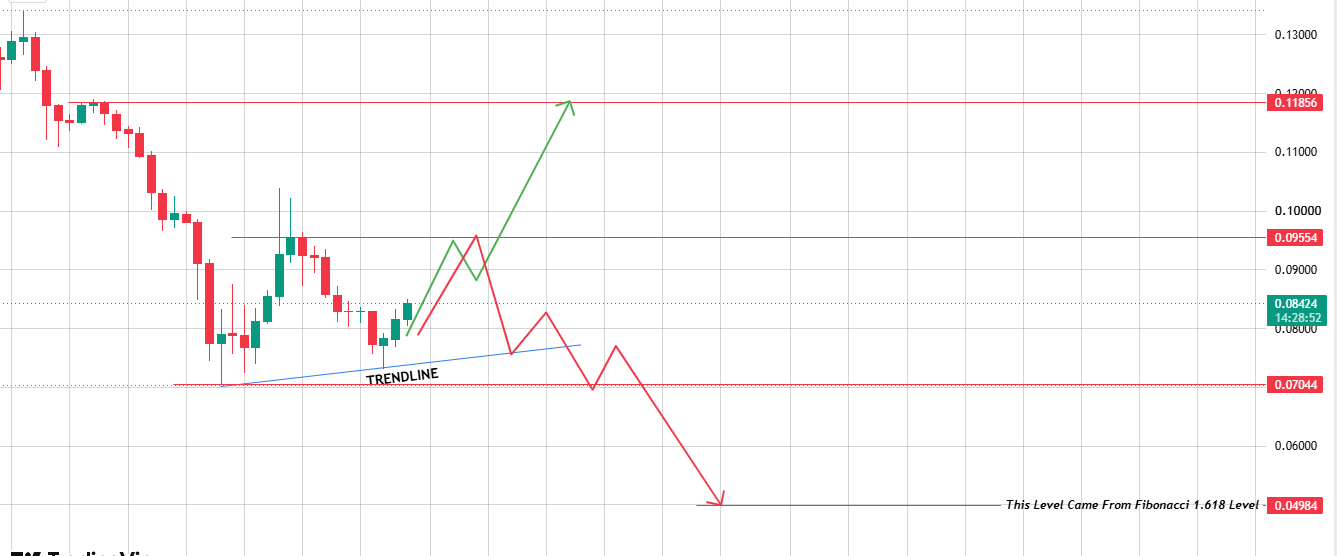
Source: Daily Chart Taken From TradingView.
Hold that trendline, and the daily targets stretch out further than the 4H ones alone: $0.09554 first, then a longer-range target near $0.11856.
Break it down instead, and the daily chart opens up a lot more room to fall, with the 1.618 Fibonacci extension pointing all the way down to $0.04984 as the deeper worst-case level.
Three-Scenario Outlook
Key Takeaways
-
$PI sits near $0.08369 right now, up 5.8% today after breaking out of a multi-week descending channel.
-
This pi-network price prediction really comes down to whether that breakout holds or gets rejected right back into the range it came from.
-
Circulating supply is still under 11% of the eventual 100B max supply, so unlock-driven dilution stays a background risk regardless of what the charts show.
-
Pi Network's own Launchpad rollout adds a longer-term utility angle, even if it isn't the thing driving today's price move.
BTC Dominance and Market Backdrop
Bitcoin dominance has been sitting in the mid-to-high 50% range through late July 2026, which tends to keep a lid on how far smaller-cap altcoins like PI can run even when their own charts look constructive.
$PI doesn't track Bitcoin or Ethereum all that closely, honestly. It still trades a lot on its own news cycle given how community-driven and relatively young the project remains, though a weak stretch for the broader altcoin market can still weigh on it even during a local breakout like this one.
Final Outlook
$PI just did the hard part; it broke above a channel it had been stuck in for weeks. What it hasn't done yet is prove that breakout sticks.
Hold above $0.08500 and clear $0.09121 with real volume, and this pi network price prediction leans toward $0.10057 and potentially the bigger daily target near $0.11856 further out.
Get rejected here instead, and a drop back through $0.07486 puts the whole move in question, with $0.07044 and eventually $0.04984 becoming the levels that matter if the descending channel basically resumes.
Given the Launchpad news adding a real utility story underneath all this, the setup leans toward watching how price behaves at resistance rather than assuming the breakout is already confirmed.
Glossary
Descending Channel: A price pattern formed by two parallel downward-sloping lines, showing a market in a controlled downtrend rather than a free fall.
Breakout: When price moves decisively outside a pattern's boundary, often signaling the start of a new directional move, though not always one that holds.
Trendline: A line connecting a series of highs or lows on a chart, showing which way price has generally been leaning.
Fibonacci Extension: A level projected beyond a prior price swing, used to estimate how far a move might travel once it clears its starting range.
Support and Resistance: Price zones where buyers or sellers have historically stepped in, capping declines or gains, respectively.
Methodology
Price levels here are pulled directly from the 4H and daily charts referenced at the time of writing, including the descending channel, trendline, and Fibonacci extension levels marked on them, nothing extrapolated beyond what's visible on the charts. Liquidation and exchange volume heatmap data weren't available for this update, so they've been left out rather than estimated.
This article does not constitute financial advice.
Disclaimer: This pi network price prediction is for informational and educational purposes only and should not be considered financial or investment advice. Cryptocurrency markets are highly volatile, and prices can change rapidly. Always conduct your own research and consult a qualified financial advisor before making any investment decisions.









.jpg)








