Pi Network Price Prediction August 2026: Levels to Watch


Pi Network started back in 2019 as a mobile app that let anyone mine networks just by tapping a button daily, with no hardware needed.
That approach built one of crypto's largest user bases years before mainnet even launched in 2025. This Pi Network price prediction August 2026 picks up right where that rocky post-launch stretch has left the chart.
Pi Network Price Today: Live Data and 24-Hour Change
Pi Network is trading near $0.07923 today, up 5.7%, after a rough stretch that took it close to its all-time low.
That bounce is exactly why this Pi Network price prediction August 2026 matters right now: 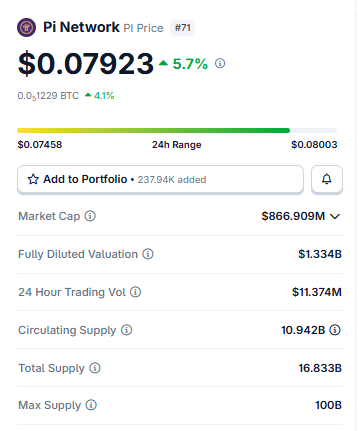
Source: $PI Market Cap Data Taken From Coingecko, data as of July 29, 2026. Figures may vary slightly across other tracking websites.
The chart is sitting at a genuine crossroads, not a confirmed trend in either direction, and both the daily and weekly charts show patterns that are about to resolve one way or the other.
Market cap sits at $866.909M, with a circulating supply of 10.942B $PI out of a max supply of 100B. This is analysis based on chart structure, not a guarantee of what happens next.
Technical Analysis: Key Support and Resistance Levels ($PI Network)
Daily Chart Analysis
On the daily chart, $PI is holding above a rising trendline that's been supporting price for a few weeks now, currently trading at $0.07872. 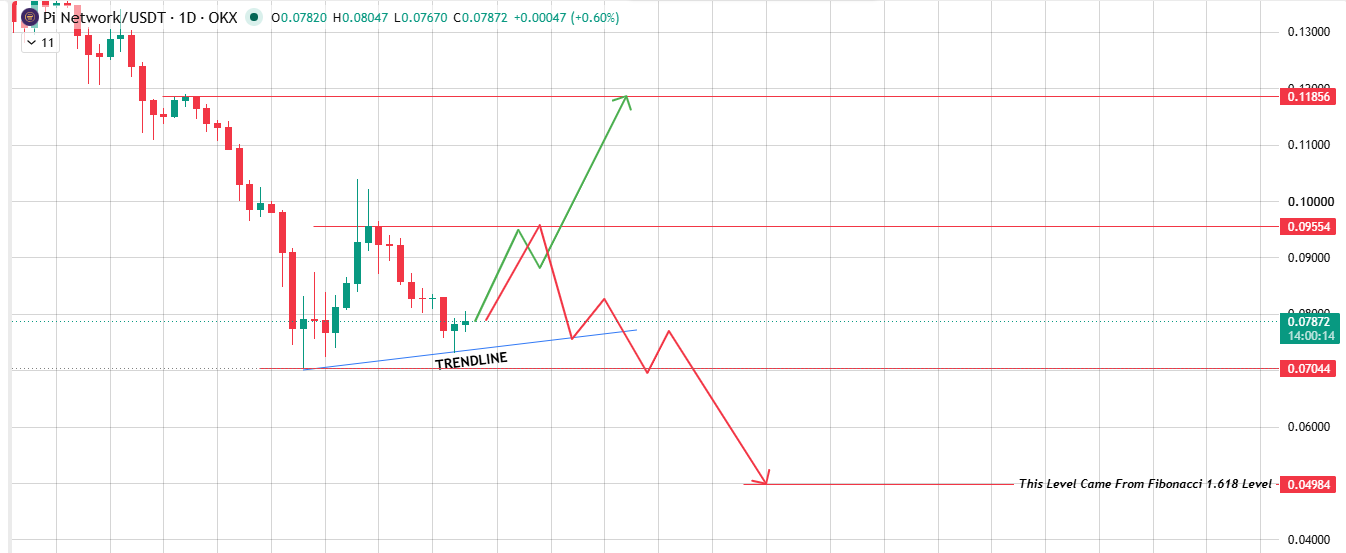
Source: Chart Taken From TradingView.
That trendline is really the whole story here: if buying volume comes in and price holds above it, the path opens toward $0.09554 first, then $0.11856 further out.
If price can't sustain above the trendline instead, it's likely to slide back down to the support level at $0.07044, with $0.04984, the Fibonacci 1.618 level, as the deeper downside marker if that support doesn't hold either.
Weekly Chart Analysis for Pi Network Prediction August 2026
Zoom out to the weekly chart, trading at $0.07859, and the Fibonacci levels are what matter most here.
The retracement zone runs through $0.12598 (0.5), $0.11285 (0.618), and $0.09416 (0.786), with $0.07035 marking the 1.0 level, right where price is currently retesting.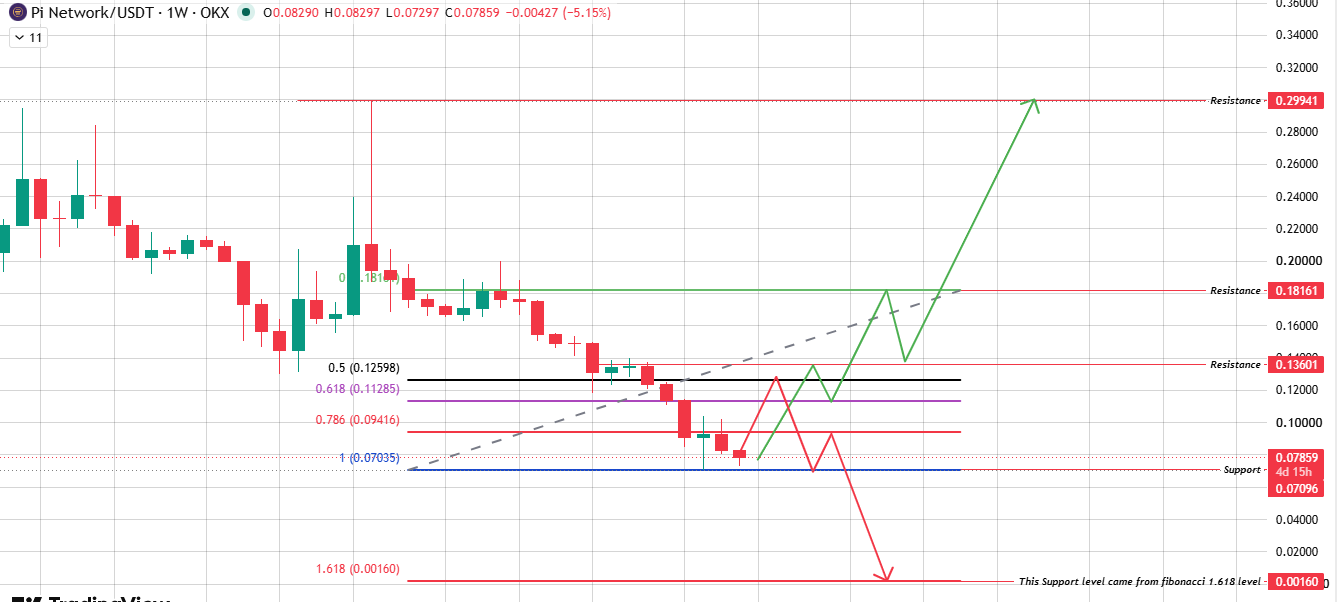
Source: Chart Taken From TradingView.
If this retest holds and the price turns back up from here, $0.13601 comes first, then $0.18161, and $0.29941 is a stretch target further out.
If it doesn't hold, the price is more likely to fall from this zone down toward the extreme $0.00160 level, which comes from the 1.618 Fibonacci extension.
Pi Network Price Prediction for August 2026: Bull, Base, and Bear Cases
Everything in this pi Network price prediction August 2026 comes down to two things lining up at once: a rising trendline holding the price up on the daily chart and a falling wedge still playing out on the weekly view.
Both are at a point where a real move, one way or the other, looks overdue.
| Scenario | August 2026 Target | Invalidation Level |
|---|---|---|
| Bull | $0.09554 – $0.13601 | Rejection at the resistance level or daily close below $0.07044 |
| Base | $0.07044 – $0.09416 (Range-Bound) | Confirmed close outside either level |
| Bear | $0.07044 – $0.04984 | Break and hold below $0.07044 |
The bull case needs the daily trendline to hold with real volume stepping in behind it, followed by a break-resistance line on the weekly view, which opens the door toward $0.09554 first and $0.13601 further out.
The base case is simpler: price just keeps chopping between current support and that first resistance band without picking a side.
The bear case takes over if the price fails to sustain above the trendline and the $0.07044 zone gives way instead, which is also the 1.0 Fibonacci retracement level on both timeframes.
August 2026 Catalysts That Could Move Pi Network
Continued token unlocks remain the biggest overhang here, since new supply entering circulation faster than demand can absorb it has been the main driver behind PI's decline over recent months.
Broader alt-network liquidity conditions matter too. If capital rotates back into smaller-cap tokens.
A $PI compressed chart pattern could resolve upward quickly; if liquidity stays tight, the wedge and triangle are more likely to break lower instead.
What Analysts Are Forecasting (Pi Network)
Chart-based reads on $PI right now describe a network at a real decision point rather than one already trending.
The daily trendline and the weekly wedge are both being tested at the same time, and how price behaves at these levels over the next few sessions should say a lot about which way this resolves.
Sentiment stays cautiously constructive as long as $0.07044 holds and turns more defensive if that floor breaks.
This is chart-and-data analysis, not individualized financial advice; crypto markets are volatile, and past patterns don't guarantee future results.
Pi Network Long-Term Outlook: 2027 to 2030
If $0.07044 holds through the rest of 2026, a gradual climb toward the $0.13601 to $0.18161 band looks plausible across 2027 and 2028, based on how the weekly Fibonacci level has behaved so far.
What PI is worth by 2030 depends far more on real adoption and how the remaining token supply gets absorbed than on any single chart level.
Risks That Could Invalidate This Forecast
The main risk is a confirmed breakdown below $0.07044, which would open the path toward the deeper $0.04984 and $0.00160 extension levels in a severe scenario.
On the upside, a broader liquidity rotation into altNetworks could push PI through resistance faster than the bull case assumes.
Disclaimer: This Pi Network price prediction is for informational and educational purposes only and should not be considered financial or investment advice. Cryptocurrency markets are highly volatile, and prices can change rapidly. Always conduct your own research and consult a qualified financial advisor before making any investment decisions.









.jpg)








