Polkadot Price Prediction: $DOT Reversal Fuels $0.9782 Watch


Polkadot price prediction interest is picking up after Polkadot pulled off one of those moves that catches short sellers completely off guard.
Something snapped back almost instantly on the four-hour chart, the kind of reversal that only makes sense once you see how fast price undid what looked like a breakdown just a few candles earlier.
Liquidation data is backing up just how sharp that move really was. Here is the full picture.
Polkadot Price Today: Live DOT Data and 24-Hour Change
Polkadot is trading at $0.9079 at the time of this snapshot, up 3.68% on the day after adding about $0.0322 in the past 24 hours.
Futures volume across exchanges stands at $173.33 million against spot volume of $33.75 million, showing derivatives traders are firmly in control of DOT's short-term price swings right now.
Open interest sits at $1.55 billion, a fairly hefty number relative to the coin's size, pointing to a lot of active leveraged positioning around current levels.
Polkadot's market cap is at $1.55 billion, with a circulating and total supply of 1.70 billion DOT out of a max supply of 2.10 billion tokens.
Source: CoinGlass, Polkadot market data, accessed September 5, 2026.
Polkadot Liquidation Data: Shorts Take the Bigger Hit
The liquidation numbers back up just how sharp this reversal was for anyone positioned the wrong way.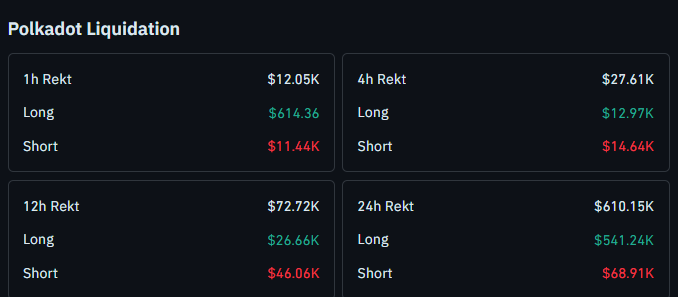
Over the past hour, DOT liquidated $12.05 thousand in total, with shorts accounting for $11.44 thousand of that against just $614 in long liquidations.
Zooming out to the 24-hour window, total liquidations reached $610.15 thousand, and shorts made up the much larger share at $68.91 thousand compared to $541.24 thousand in longs actually wiped out over the same period, though the 1-hour and 4-hour windows tell the more immediate story of shorts getting caught in the fake breakdown reversal.
This kind of skew toward short liquidations right after a sudden reversal is a fairly common signature of exactly the trap-and-squeeze pattern showing up on the chart.
Source: CoinGlass, Polkadot liquidation data, accessed September 5, 2026.
Polkadot Price Forecast: DOT Price Prediction and Breakout Levels
On the 4-hour chart, DOT had been climbing along an ascending trendline for a while and then suddenly broke down below it.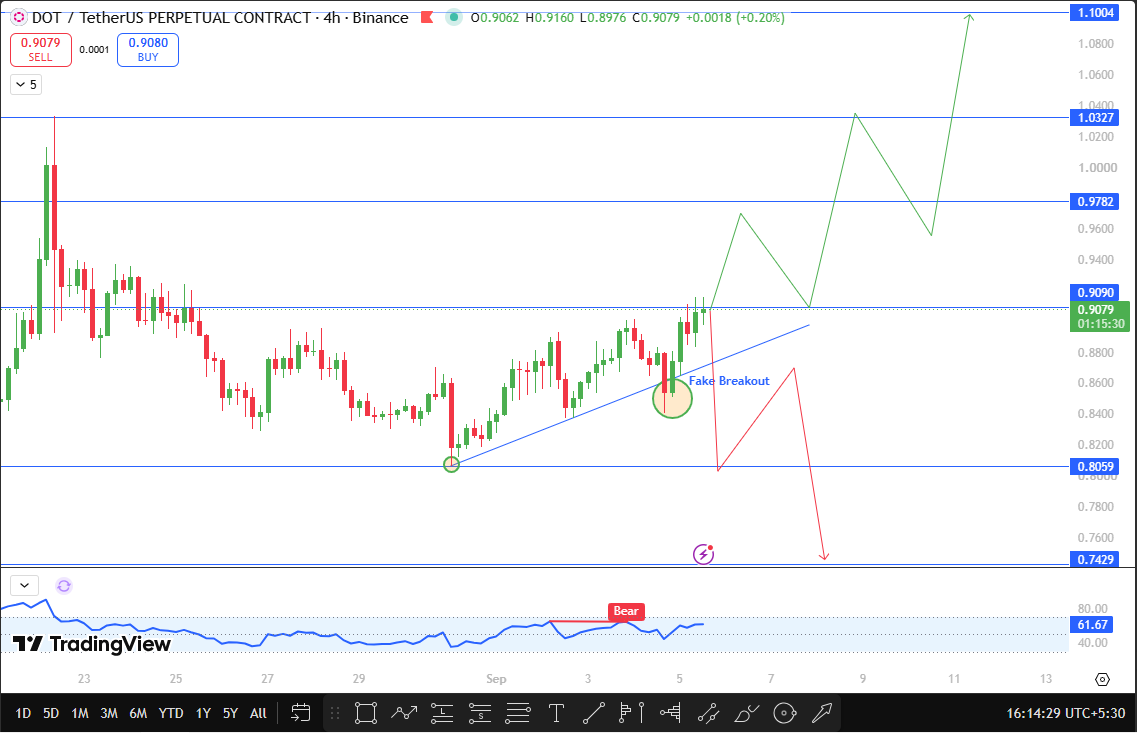
At first glance that looked like a real trendline breakdown, the kind of move that usually invites more selling. Instead, the price reversed almost instantly and broke back above its recent high, which flips the whole read on that move.
Rather than a genuine breakdown, this now looks like a fake breakout to the downside, a liquidity grab that trapped sellers before the price turned right back up.
The key level to watch now is 0.9090. If DOT holds above that zone, the next resistance target is 0.9782, roughly 7.7% above the current DOT price.
From there, 1.0327 comes into view, about 13.7% higher than where DOT trades today, and the major resistance further out sits at 1.1004, close to a 21.2% gain from current levels if this recovery keeps extending.
The downside scenario still deserves attention even after this reversal.
If DOT breaks and closes below 0.8059, roughly 11.2% under current price, that would undo the bullish read from this fake breakdown and open the door toward 0.7429, about 18.2% below current levels, which is the next support zone marked on the chart.
For now, the sharp reversal and recovery above the recent high keep the bullish scenario in play, but holding above 0.9090 on the next few four-hour closes is what will confirm whether this bounce has real staying power.
Source: TradingView chart, Polkadot DOT/USDT perpetual contract, Binance, 4H timeframe, snapshot dated September 5, 2026.
Polkadot Support and Resistance Levels
Level Type | Price | Change from CMP |
Resistance 3 (Major) | 1.1004 | +21.2% |
Resistance 2 | 1.0327 | +13.7% |
Resistance 1 | 0.9782 | +7.7% |
Hold Zone | 0.9090 | +0.1% |
Current Price (CMP) | 0.9079 | — |
Breakdown Trigger | 0.8059 | -11.2% |
Support 1 | 0.7429 | -18.2% |
Bull, Base, and Bear Case for Polkadot
In the bullish case, $DOT holds above 0.9090, the fake breakdown reversal keeps pressuring short positions, and price grinds up through 0.9782, then 1.0327, and eventually toward the 1.1004 major resistance.
The base case has $DOT chopping between 0.8059 and 0.9782 for a while, digesting this sharp reversal and giving the market time to decide if the squeeze has more room to run before committing further.
The bearish case shows up if $DOT loses 0.9090 and then breaks down through 0.8059. That would suggest the earlier fake breakdown was actually an early warning rather than a trap, and DOT could slide toward the 0.7429 support zone from there.
Risks to Watch
Open interest above $1.5 billion relative to DOT's size means leverage is playing a big role in these swings, and the recent short liquidation spike shows how quickly that can flip against one side of the market.
A move like this can just as easily reverse again if fresh sellers step back in near resistance, so treating 0.9090 as a level to confirm rather than assume matters here.
Broader crypto sentiment and any fresh Polkadot ecosystem news could also override this technical picture in the short term.
Dot Glossary
Fake breakdown: A move below a key support or trendline that quickly reverses, often trapping sellers who entered on the initial break.
Short liquidation: The forced closing of a leveraged short position when price moves against it, often accelerating an upward move.
Open interest: The total number of outstanding derivative contracts that have not been settled, used as a gauge of active leveraged positioning.
Ascending trendline: A line drawn along a series of rising lows that acts as dynamic support while price trends upward.
Disclaimer
This article is for informational purposes only and does not constitute financial, investment, or trading advice. Cryptocurrency markets are highly volatile, and price predictions are based on technical analysis that can change quickly with new market data. Always conduct independent research and consult a qualified financial advisor before making investment decisions.
Also read:

















