Polkadot Price Prediction: Is the DOT Breakout Still Alive?


Polkadot price prediction interest is climbing as DOT works through a pullback after clearing a trendline that had capped it for months.
The coin broke out on its fifth attempt at a long tested descending trendline, rallied close to seven percent off that move, and has now slipped back down through the short term ascending trendline that carried it higher.
All levels referenced below are swing highs and lows drawn directly from the chart structure.
Polkadot Trend and Momentum Key Takeaways for DOT Traders
DOT tested its descending trendline four times before finally breaking out on the fifth attempt with a strong volume candle
That breakout drove close to a seven percent rally before the price started cooling off
DOT has since broken below its short-term ascending trendline and is pulling back toward $0.7950 and $0.7869.
Holding that zone without a close below it would count as a retest, keeping the door open for another breakout attempt
A fresh breakout from there targets $0.9090 first, then $0.9782, with $1.0450 and $1.1004 possible if Bitcoin sentiment stays supportive
A confirmed close below $0.7869 to $0.7950 would fail the retest and shift focus down to $0.7429
The built-in momentum oscillator RSI is reading 49.94, roughly neutral after an earlier bearish tag and a more recent bullish tag
DOT Price Right Now on the 4-Hour Polkadot Chart
Metric | Value |
Price | $0.8248 |
4H Open / High / Low / Close | $0.8520 / $0.8540 / $0.8330 / $0.8490 |
24H Change | -2.78% (-$0.02357) |
Market Cap | $1.39B |
Futures Volume (24H) | $110.97M |
Spot Volume (24H) | $12.43M |
Open Interest | $150.10M |
Circulating Supply | 1.69B |
Total Supply | 1.69B |
Max Supply | 2.10B |
Open interest is the total value of derivative contracts still open across exchanges, a rough gauge of how much leveraged positioning is sitting behind this Polkadot price move right now.
Chart source: DOT/USDT perpetual contract, 4 hour timeframe, TradingView, Binance data feed, captured August 6, 2026, around 04:04 PM IST (10:34 UTC).
Market cap, volume, and supply data from Polkadot market data on CoinGlass were captured the same day.
Methodology and Data Sources Behind This DOT Price Forecast
This DOT technical analysis uses the 4-hour chart for trendline structure, with price, volume, open interest, and market cap figures from CoinGlass. liquidation flow from CoinGlass's liquidation tracker, and multi-timeframe performance data for added context.
Levels are only treated as invalidated on a confirmed closing candle beyond the stated trigger, not an intraday wick.
How Has Polkadot Price Performed Across Multiple Timeframes?
Beyond the immediate chart setup, Polkadot's wider performance record is worth flagging for anyone weighing this DOT price prediction against the bigger picture.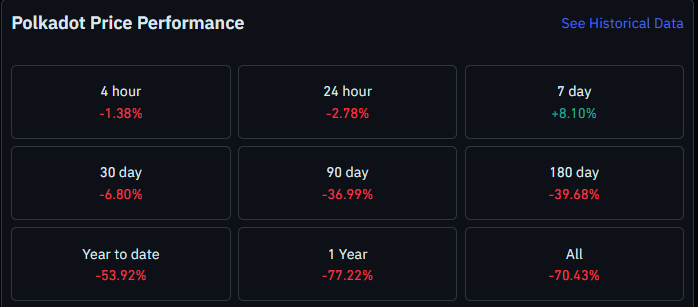
DOT is down 1.38% over 4 hours and 2.78% over 24 hours, but it is still up 8.10% across the past 7 days.
Zooming out further tells a very different story, with DOT down 6.80% over 30 days, 36.99% over 90 days, 39.68% over 180 days, 53.92% year to date, 77.22% over 1 year, and 70.43% across its full tracked history.
That backdrop is a reminder that this trendline breakout is unfolding inside a coin still deep below its longer-term highs.
Source: Polkadot price performance data, CoinGlass, captured August 6, 2026.
Polkadot Liquidation Snapshot for Long and Short Positions
Liquidation data from CoinGlass shows longs have taken the bulk of recent losses.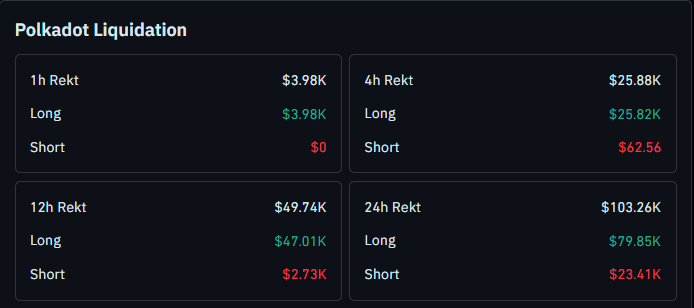
The 1-hour window saw $3.98K total, all of it from longs. The 4-hour window shows $25.88K total, with $25.82K from longs against just $62.56 from shorts.
That long heavy lean continues over 12 hours, with $49.74K in total liquidations and $47.01K coming from longs, and again over 24 hours, where $103.26K in total liquidations includes $79.85K from longs against $23.41K from shorts.
Source: Polkadot liquidation data, CoinGlass, checked August 6, 2026, around 04:04 PM IST.
Is the DOT Trendline Breakout Still Intact After This Pullback?
Is Polkadot's trendline breakout still alive after this pullback, or has the move already lost its edge? The retest zone just below the current price is the level that answers that question, and it has not broken yet.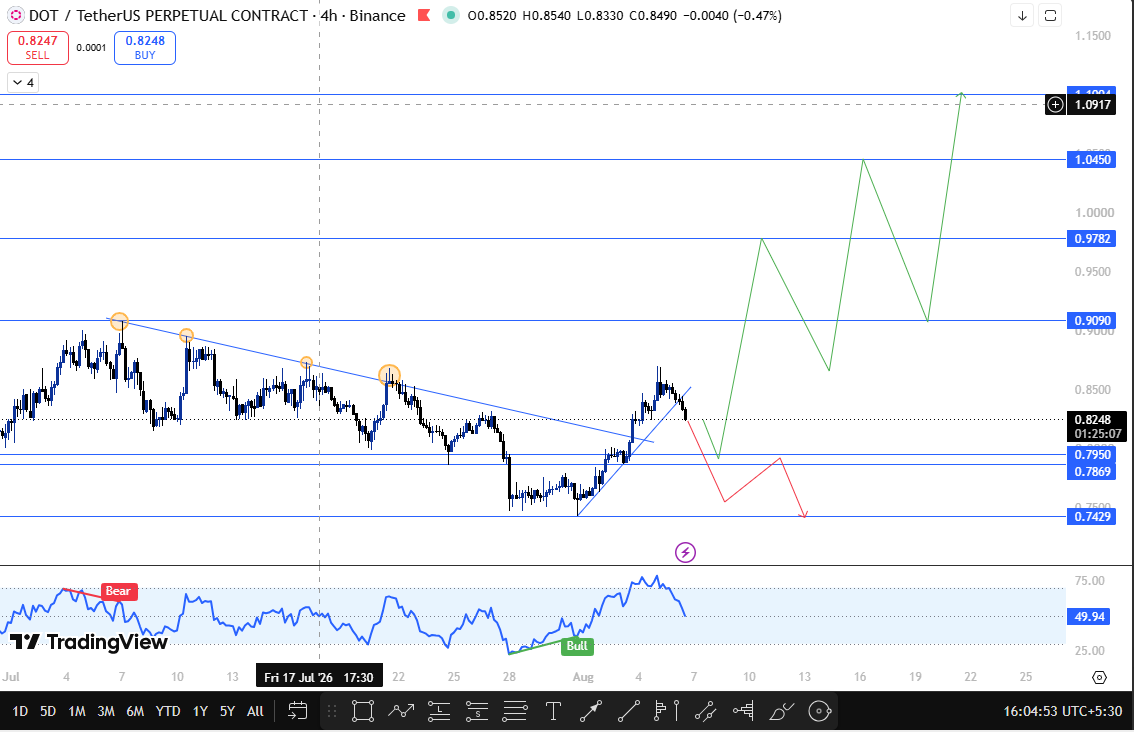
DOT spent weeks testing a descending trendline four separate times without ever clearing it, a pattern that usually points to a well-respected resistance line.
The fifth test was different, arriving with a strong volume candle that pushed the price through the line and kept going, adding close to 7% to DOT's price in a fairly short window.
That kind of move rarely goes in a straight line, and DOT has since pulled back below the short-term ascending trendline that formed during the rally itself. Price is now approaching a support zone between $0.7950 and $0.7869.
As long as DOT holds that zone and does not close below it, this pullback counts as a retest rather than a failure, and the setup stays in position for another breakout attempt.
If that breakout does follow, the first resistance to watch is $0.9090, with $0.9782 next in line.
Beyond that, $1.0450 and $1.1004 come into view, though those two levels carry a condition attached to them, since they depend on Bitcoin holding a supportive tone and broader market sentiment staying constructive rather than DOT's own chart alone.
The momentum oscillator RSI reading of 49.94 sits almost exactly at the midline, a fairly neutral signal that leaves this Polkadot price prediction genuinely balanced between the two outcomes right now.
The downside case is simple by comparison. A confirmed close below the $0.7869 to $0.7950 zone would mean the retest failed, and that would point to $0.7429 as the next support level to watch.
Technical Outlook Snapshot for the Polkadot Price Setup
Indicator | Signal |
Descending Trendline | Broken on the fifth test with a volume confirmed candle |
Ascending Trendline | Broken below during the current pullback |
Momentum Oscillator | 49.94, roughly neutral after an earlier bearish tag and a recent bullish tag |
Immediate Bias | Retest in progress at $0.7950 to $0.7869; needs to hold to stay bullish. |
DOT Support and Resistance Levels Traders Are Watching
Type | Level | Note | % From CMP |
Conditional resistance | $1.1004 | Bull continuation target, needs supportive BTC sentiment, swing high | +33.41% |
Conditional resistance | $1.0450 | Bull continuation target, needs supportive BTC sentiment, swing high | +26.70% |
Resistance 2 | $0.9782 | Second breakout target, swing high | +18.60% |
Resistance 1 | $0.9090 | First breakout target, swing high | +10.21% |
Current Price | $0.8248 | Sitting below the broken ascending trendline | — |
Retest Support | $0.7950 | Upper edge of the retest zone, swing low | -3.61% |
Breakdown Trigger | $0.7869 | Lower edge of the retest zone, swing low | -4.60% |
Support 1 | $0.7429 | Next, support if the retest zone fails; swing low. | -9.93% |
Risk-Reward Table for This DOT Price Prediction
Case | Trigger | Target |
Bull Case | Holds $0.7869 to $0.7950 and breaks out again | Move toward $0.9090 then $0.9782, with $1.0450 and $1.1004 possible if BTC sentiment stays supportive |
Bear Case | Closes below $0.7869 | Slide toward $0.7429 as the retest fails |
What Would Change This Polkadot Price Prediction Going Forward?
The setup stays undecided while the price holds above $0.7869.
A retest hold followed by a confirmed breakout would validate the bullish structure and put $0.9090 back in focus, while a close below $0.7869 would suggest the retest has failed and shift attention to $0.7429.
How Bitcoin Market Sentiment Could Influence the Polkadot Price Move
This setup is built off DOT's own chart, but the extended targets at $1.0450 and $1.1004 are explicitly tied to Bitcoin holding a supportive tone.
A steadier Bitcoin tape improves the odds of DOT clearing $0.9782 and pushing into that extended zone, while a weaker Bitcoin backdrop raises the risk that DOT loses the $0.7869 to $0.7950 retest zone and slides toward $0.7429.
When This DOT Price Prediction Will Be Revisited
This Polkadot price prediction will be revisited on a confirmed close above $0.9090 or below $0.7869, or if no clear direction is confirmed within 24 hours of publication.
Glossary of Terms Used in This DOT Technical Analysis
Descending Trendline: A downward sloping line connecting a series of lower highs, used to track resistance during a downtrend
Ascending Trendline: An upward-sloping line connecting a series of higher lows, used to track directional support during an uptrend
Retest: When a price returns to a broken trendline or level to test it as new support or resistance before continuing in the breakout direction
Swing High and Swing Low: A local peak or trough on a chart where price reversed direction, commonly used to mark support and resistance
Open Interest: The total value of derivative contracts still open and unsettled
Liquidation: The forced closing of a leveraged position when a trader runs out of margin
Polkadot Bull Base and Bear Case Scenarios for DOT
Bull Case: DOT holds the $0.7950 to $0.7869 retest zone, confirms the breakout is still valid, and pushes through $0.9090 toward $0.9782, with $1.0450 and $1.1004 opening up further if Bitcoin sentiment stays supportive.
Base Case: DOT chops between $0.7869 and $0.8520 while the market waits for a decisive close in either direction, keeping this polkadot price forecast a wait and watch situation for now.
Bear Case: DOT loses the retest zone, closes below $0.7869, and the fifth time breakout attempt fails to hold, sending price down toward $0.7429 as the next swing low support.
Disclaimer
This polkadot price prediction is based on technical chart analysis and market data available at the time of writing. Cryptocurrency markets are highly volatile, and prices can change rapidly. This content is for informational purposes only and should not be considered financial advice. CoinGabbar and the analyst do not hold a position . Always do your own research and consult a qualified financial advisor before making any investment decisions.


















