Pepe Price Prediction: PEPE Eyes Recovery After Sharp Pullback


Pepe price prediction has to start with a bit of a contradiction, because the chart just turned bullish while the price itself is still falling.
Pepe launched as a pure internet-culture meme coin with no promised utility, and it built one of the largest, loudest communities in crypto purely on that identity.
$PEPE is currently trading at $0.00000353, down 3.6% on the day, after breaking out of a week-long descending channel on a volume spike.
Pepe Live Market Data
Metric | Value |
Price | $0.00000353 |
24h Change | -3.6% |
24h Range | $0.00000344 - $0.00000370 |
Market Cap | $1.486B |
Fully Diluted Valuation | $1.486B |
24h Trading Volume | $269.215M |
Circulating Supply | 420.69T |
Total Supply / Max Supply | 420.69T |
Exchange Volume
OKX is carrying the largest share of PEPE volume at $121.49M, with MEXC not far behind at $86.91M.
LBank comes in next at $30.34M, followed by Bitget at $29.29M and Gate at $21.03M.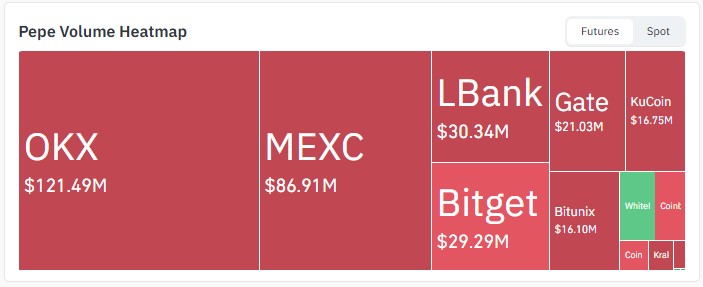
Source: Volume Heatmap Data Taken From CoinGlass, As of Sep 5, 2026
KuCoin and Bitunix round things out with smaller contributions. Nothing unusual here; OKX and MEXC have handled the bulk of PEPE flow for a while now.
Liquidation Data
Timeframe | Total Liquidated | Longs | Shorts |
1h | $5.34 | $0 | $5.34 |
4h | $11.26K | $0 | $11.26K |
12h | $105.89K | $92.38K | $13.51K |
24h | $557.83K | $495.35K | $62.48K |
Over 24 hours, longs have clearly taken the worse end of this, losing $495.35K against just $62.48K on shorts.
That lopsided ratio tracks with a market where buyers jumped in on the breakout, only to get caught as the price pulled back instead of following through.
Pepe Price Prediction Outlook: Technical Analysis
The 4-hour PEPE/USDT chart on Binance shows the price breaking out of a descending channel it had been stuck in for over a week.
The breakout candle carried real volume, and a fresh ascending channel has since formed on the chart.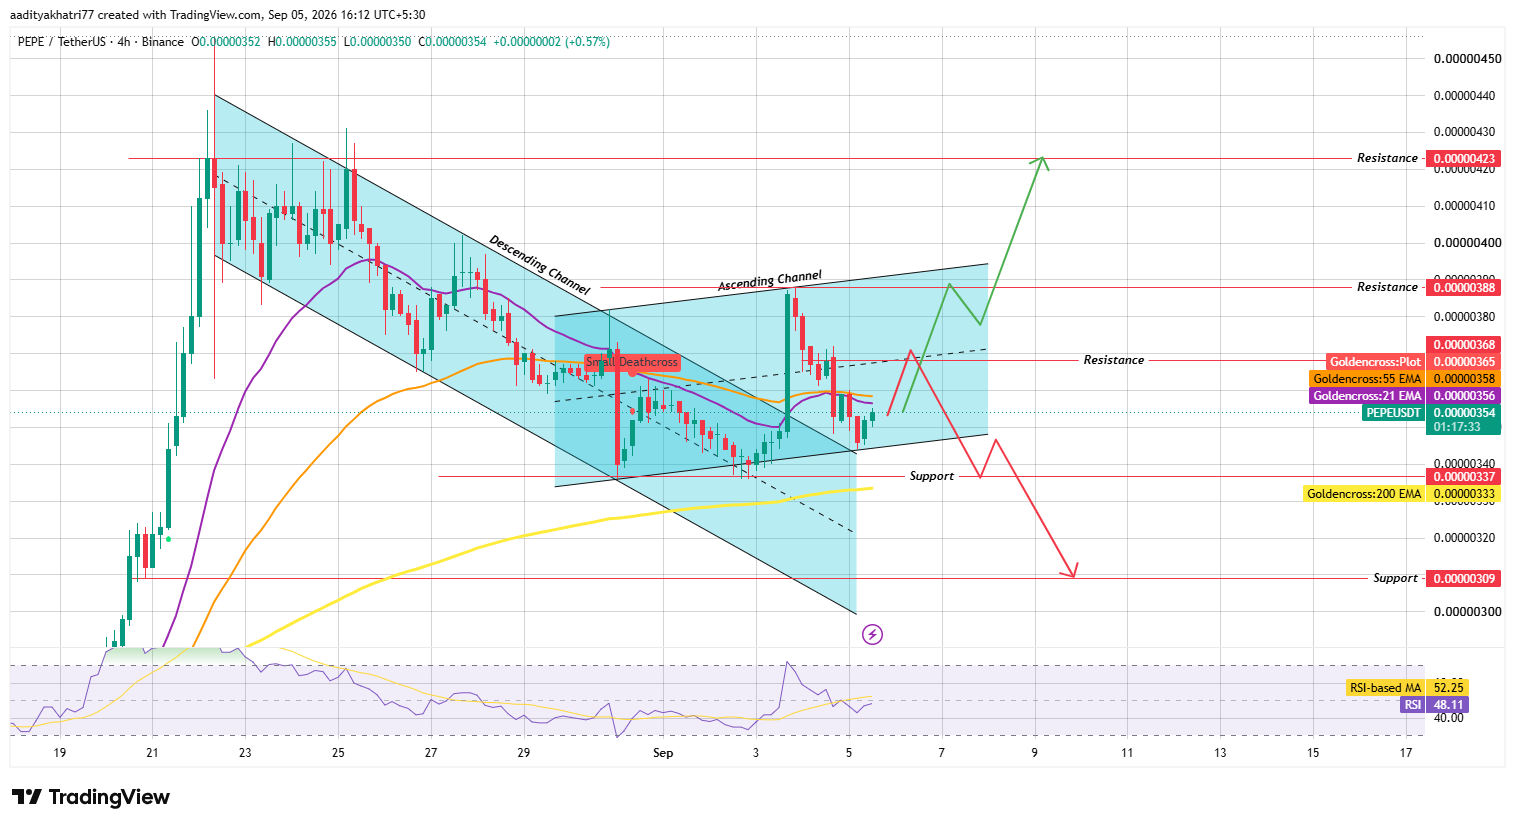
Source: Chart Taken From TradingView, As of Sep 5, 2026
Right now, price is sitting inside this new structure but still trading lower on the day, meaning the bullish setup hasn't translated into price action just yet.
Can $PEPE Push Toward Higher Resistance?
For bulls to take control here, $PEPE needs to clear the nearby resistance zone with volume behind the move.
Do that, and $0.00000388 becomes the first level, with $0.00000423 as the extended goal if buyers keep showing up.
What Happens If $PEPE Gets Rejected at Resistance?
If price fails at resistance instead, a drop toward the ascending channel's lower boundary becomes the more likely path.
Break below that boundary on a confirmed close, and $0.00000337 comes into view first. Lose that too, and $0.00000309 is the next stop.
RSI is sitting at 48.11, just under neutral, with its moving average slightly higher at 52.25. That gap suggests momentum hasn't confirmed the bullish structure yet, so this remains a wait-and-see setup for now.
Support and Resistance Levels (4H Chart)
Level Type | Price |
Resistance 2 | $0.00000423 |
Resistance 1 | $0.00000388 |
Support 1 | $0.00000337 |
Support 2 | $0.00000309 |
EMA | Price |
21 EMA | $0.00000356 |
55 EMA | $0.00000358 |
200 EMA | $0.00000333 |
Pepe Price Prediction: Bull, Base, and Bear Scenarios
Scenario | Setup | Level |
Bull Case | Resistance clears with volume, and the ascending channel breaks upward. | $0.00000388, then $0.00000423 |
Base Case | Price chops inside the ascending channel without a clear break. | Range-bound between $0.00000340 and $0.00000370 |
Bear Case | Rejection at resistance, break below the channel's lower boundary | $0.00000337, with risk toward $0.00000309 |
Descending Channel: Two parallel trendlines sloping down, boxing price in until it breaks out one way or the other.
Ascending Channel: The mirror version, support and resistance both trend upward, and price bounces between them as the broader move climbs.
Small Death Cross: A minor version of a shorter moving average slipping below a longer one, usually more of a caution flag than a full trend reversal.
RSI (Relative Strength Index): A 0-100 momentum gauge showing how fast and how far price has moved, used to spot overbought or oversold conditions.
Liquidation: When an exchange force-closes a leveraged position because there isn't enough margin left to cover the loss.
Pepe vs Bitcoin
$PEPE's channel breakout looks tied to its own chart rather than anything specific happening with Bitcoin right now.
Meme coins like $PEPE tend to amplify Bitcoin's broader direction rather than chart an independent course, so Bitcoin's next move still matters here.
$PEPE's order book is far more retail and leverage-driven than Bitcoin's, which is exactly why a $557.83K liquidation swing shows up on a token this size. Bitcoin's deeper, more institutional order book usually holds its levels more predictably.
If Bitcoin holds steady or climbs, that probably helps $PEPE clear its resistance zone. If Bitcoin rolls over, this recovery attempt could break down just as fast and likely be sharper.
Expert Opinion
Traders following $PEPE's breakout note that flipping from a descending to an ascending channel on strong volume is typically a constructive signal on its own.
What's keeping this one interesting is the disconnect between that bullish structure and $PEPE still trading down 3.6% on the day.
Whether $PEPE closes that gap by clearing resistance or instead breaks down through the ascending channel is the thing worth watching over the next session or two.
Disclaimer: This Pepe price prediction is based on technical chart analysis and current market data and should not be treated as financial advice. Cryptocurrency markets are highly volatile, and actual price movements may deviate significantly from projected scenarios. Support and resistance levels discussed represent probability zones, not guaranteed outcomes, and downside risk exists at every stage of this analysis. Readers should conduct independent research before making investment decisions.
Also read:
3 weeks ago
Honestly, I didn't know where to turn after losing my Bitcoin in an online scam. I was frustrated and unsure of the next steps, so I contacted WEB WIZARD CRYPTO RECOVERY EXPERTS. They took the time to listen to what happened, reviewed the transaction details I had, and explained the investigation process in a way I could understand. I appreciated their professionalism and straightforwardness throughout the entire process, especially when they explained what could realistically be investigated. I am very happy to have successfully recovered my Bitcoin. The experience gave me a much clearer understanding of my case. If you are facing a similar problem to the one I had before recovering my funds, I personally recommend contacting WEB WIZARD CRYPTO RECOVERY EXPERTS for help. Email: (fundrecoverywebwizard@mail.com) Website: https://webwizardcryptorecoveryexperts.simdif.com/

1 month ago
I invested in bitcoin trading After losing $78.4 USDT) linked to a romance fraud scam worth of cryptocurrency through an online investment platform and later discovered it was a scam. After extensive research for recovery options, I contacted CAPITAL CRYPTO RECOVER based on positive client reviews and recommendations. Their professional security team guided me through the recovery process using advanced technology, and I was able to recover my lost cryptocurrency successfully. I am truly grateful for their support and assistance during such a difficult experience. I will advise you to contact CAPITAL CRYPTO RECOVER helped me recover my funds. For anyone facing similar issues, Website: https://recovercapital.wixsite.com/capital-crypto-rec-1 Email: Capitalcryptorecover@zohomail.com Telegram: @Capitalcryptorecover Contact: Recoverycapital@fastservice.com WhatsApp/Text Number: +1 (336) 390-6684
1 month ago
HOW TO GET A PROFESSIONAL RECOVERY EXPERT IN CANADA, UNITED STATES, MEXICO, INDIA, CHINA META TECH RECOVERY PRO META TECH RECOVERY PRO is a trusted, independent cyber-intelligence and digital recovery firm. We investigate and remediate sensitive information incidents across multiple blockchain and financial environments, including Bitcoin, USDT, USDC, Ethereum, and other widely used digital assets. Our mission is to help clients regain control, protect data, and restore integrity after unauthorized access, fraud, personal information exposure, or inappropriate online content. WhatsApp +1 469 692 8049 Using disciplined digital forensics and risk analysis, we provide end-to-end recovery support: tracing suspicious activity, identifying likely sources of cyber incidents, reconstructing event timelines, and performing secure data recovery when feasible. We also assist with consent-free exposure removal or erasure, including confidential records, private images, doxing-related content, and other materials that violate privacy standards. Contact them via Metatech@Writeme.Com Our method is professional and structured: each engagement begins with an assessment of incident scope, impacted platforms or accounts, and available indicators. We then apply targeted techniques such as digital footprint analysis, linkage evaluation across online identifiers, and verification of transaction or account trails to determine the most effective recovery and mitigation path. We operate under a NO UPFRONT fee model until completion, ensuring accountability, aligning incentives with client objectives, and reducing financial uncertainty. Clients typically seek help with hacked wallets or compromised accounts, suspicious crypto transfers, identity exposure, unlawful posting of private content, impersonation, online harassment, and other forms of digital wrongdoing. We deliver actionable outcomes, including enhanced protection measures, targeted takedown support, and recovery strategies designed to minimize recurrence. If your personal data has been leaked, your accounts compromised, or inappropriate content has appeared online, we can investigate promptly and pursue resolution with discretion, accuracy, and professionalism.Reach out to them via - Telegram:@metatechrecoveryproteam - - WhatsApp: +1 4 6 9 6 9 2 8 0 4 9 - - Metatech@Writeme.Com -
1 month ago
HOW TO GET A PROFESSIONAL RECOVERY EXPERT IN CANADA, UNITED STATES, MEXICO, INDIA, CHINA META TECH RECOVERY PRO META TECH RECOVERY PRO is a trusted, independent cyber-intelligence and digital recovery firm. We investigate and remediate sensitive information incidents across multiple blockchain and financial environments, including Bitcoin, USDT, USDC, Ethereum, and other widely used digital assets. Our mission is to help clients regain control, protect data, and restore integrity after unauthorized access, fraud, personal information exposure, or inappropriate online content. WhatsApp +1 469 692 8049 Using disciplined digital forensics and risk analysis, we provide end-to-end recovery support: tracing suspicious activity, identifying likely sources of cyber incidents, reconstructing event timelines, and performing secure data recovery when feasible. We also assist with consent-free exposure removal or erasure, including confidential records, private images, doxing-related content, and other materials that violate privacy standards. Contact them via Metatech@Writeme.Com Our method is professional and structured: each engagement begins with an assessment of incident scope, impacted platforms or accounts, and available indicators. We then apply targeted techniques such as digital footprint analysis, linkage evaluation across online identifiers, and verification of transaction or account trails to determine the most effective recovery and mitigation path. We operate under a NO UPFRONT fee model until completion, ensuring accountability, aligning incentives with client objectives, and reducing financial uncertainty. Clients typically seek help with hacked wallets or compromised accounts, suspicious crypto transfers, identity exposure, unlawful posting of private content, impersonation, online harassment, and other forms of digital wrongdoing. We deliver actionable outcomes, including enhanced protection measures, targeted takedown support, and recovery strategies designed to minimize recurrence. If your personal data has been leaked, your accounts compromised, or inappropriate content has appeared online, we can investigate promptly and pursue resolution with discretion, accuracy, and professionalism.Reach out to them via - Telegram:@metatechrecoveryproteam - - WhatsApp: +1 4 6 9 6 9 2 8 0 4 9 - - Metatech@Writeme.Com -
1 month ago
HOW TO GET A PROFESSIONAL RECOVERY EXPERT IN CANADA, UNITED STATES, MEXICO, INDIA, CHINA META TECH RECOVERY PRO META TECH RECOVERY PRO is a trusted, independent cyber-intelligence and digital recovery firm. We investigate and remediate sensitive information incidents across multiple blockchain and financial environments, including Bitcoin, USDT, USDC, Ethereum, and other widely used digital assets. Our mission is to help clients regain control, protect data, and restore integrity after unauthorized access, fraud, personal information exposure, or inappropriate online content. WhatsApp +1 469 692 8049 Using disciplined digital forensics and risk analysis, we provide end-to-end recovery support: tracing suspicious activity, identifying likely sources of cyber incidents, reconstructing event timelines, and performing secure data recovery when feasible. We also assist with consent-free exposure removal or erasure, including confidential records, private images, doxing-related content, and other materials that violate privacy standards. Contact them via Metatech@Writeme.Com Our method is professional and structured: each engagement begins with an assessment of incident scope, impacted platforms or accounts, and available indicators. We then apply targeted techniques such as digital footprint analysis, linkage evaluation across online identifiers, and verification of transaction or account trails to determine the most effective recovery and mitigation path. We operate under a NO UPFRONT fee model until completion, ensuring accountability, aligning incentives with client objectives, and reducing financial uncertainty. Clients typically seek help with hacked wallets or compromised accounts, suspicious crypto transfers, identity exposure, unlawful posting of private content, impersonation, online harassment, and other forms of digital wrongdoing. We deliver actionable outcomes, including enhanced protection measures, targeted takedown support, and recovery strategies designed to minimize recurrence. If your personal data has been leaked, your accounts compromised, or inappropriate content has appeared online, we can investigate promptly and pursue resolution with discretion, accuracy, and professionalism.Reach out to them via - Telegram:@metatechrecoveryproteam - - WhatsApp: +1 4 6 9 6 9 2 8 0 4 9 - - Metatech@Writeme.Com -
1 month ago
Bitcoin and cryptocurrency tracing and recovery services help individuals and organizations locate, verify, and recover digital assets when access becomes difficult due to hardware failure, corrupted files, lost backups, or incomplete wallet records. These services are built around the reality that crypto ownership is tied to blockchain addresses, but the ability to spend or move funds depends on controlling the corresponding private keys or restoring the wallet data that contains them. When a wallet file or drive is compromised, the recovery process becomes both a technical and investigative effort—combining digital forensics, blockchain analysis, and careful validation of results. This is where META TECH RECOVERY PRO plays a critical role. Their team did more than perform basic file recovery attempts; they applied structured recovery methods to restore the usable wallet information as much as possible. Beyond the recovery itself, tracing services often include linking recovered addresses to transaction history, confirming balances, and ensuring that the funds are correctly associated with the wallet being reconstructed. Reach out to them via - Telegram:@metatechrecoveryproteam - - WHATSAPP + 1 4 6 9 6 9 2 8 0 4 9 - - Metatech@Writeme.Com - For me, the process ultimately proved successful. The professionals at META RECOVERY PRO helped recover the Bitcoin I had on the drive even after I believed the situation was a lost cause. What made the outcome especially valuable was not only the restoration of access, but also the confidence that the recovered wallet corresponded to actual on-chain holdings. As a result, my earlier investment paid off in a way I did not expect, and I was able to reclaim and benefit from those funds thanks to the expertise and persistence of the recovery specialists.
1 month ago
Bitcoin and cryptocurrency tracing and recovery services help individuals and organizations locate, verify, and recover digital assets when access becomes difficult due to hardware failure, corrupted files, lost backups, or incomplete wallet records. These services are built around the reality that crypto ownership is tied to blockchain addresses, but the ability to spend or move funds depends on controlling the corresponding private keys or restoring the wallet data that contains them. When a wallet file or drive is compromised, the recovery process becomes both a technical and investigative effort—combining digital forensics, blockchain analysis, and careful validation of results. This is where META TECH RECOVERY PRO plays a critical role. Their team did more than perform basic file recovery attempts; they applied structured recovery methods to restore the usable wallet information as much as possible. Beyond the recovery itself, tracing services often include linking recovered addresses to transaction history, confirming balances, and ensuring that the funds are correctly associated with the wallet being reconstructed. Reach out to them via - Telegram:@metatechrecoveryproteam - - WHATSAPP + 1 4 6 9 6 9 2 8 0 4 9 - - Metatech@Writeme.Com - For me, the process ultimately proved successful. The professionals at META RECOVERY PRO helped recover the Bitcoin I had on the drive even after I believed the situation was a lost cause. What made the outcome especially valuable was not only the restoration of access, but also the confidence that the recovered wallet corresponded to actual on-chain holdings. As a result, my earlier investment paid off in a way I did not expect, and I was able to reclaim and benefit from those funds thanks to the expertise and persistence of the recovery specialists.

















