Polkadot Price Prediction: DOT's Next Big Test


DOT spent months sliding inside a falling channel, then broke out with a large green candle last session.
That kind of move usually forces a pause, not a straight continuation, and the chart is doing exactly that now, resting just above a key level.
Any grounded Polkadot price prediction has to start from that pause, not from the breakout candle alone.
How Is Polkadot's Market Valuation Holding Up?
$DOT is trading near $0.8725, up 2.96% over 24 hours, according to CoinMarketCap data.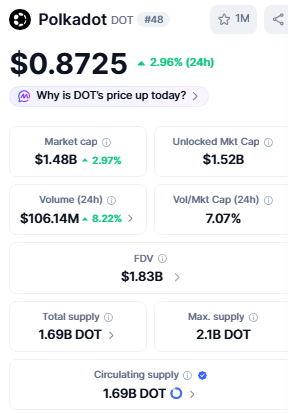
Market cap sits near $1.48 billion against a fully diluted valuation of $1.83 billion.
The circulating supply is 1.69 billion DOT out of a 2.1 billion maximum, with about 80% already circulating and 24-hour volume at $106.14 million, up 8.22%, framing the scale behind this Polkadot price prediction.
What Did the DOT DAO Just Vote On?
Governance added a fresh data point this week. Per Polkadot's official X account, Wish for Change #1926 passed with DAO support for burning 100% of any DOT received from future $JAMKB sales instead of routing it to the treasury and against distributing $JAMKB through grants or below-market loans.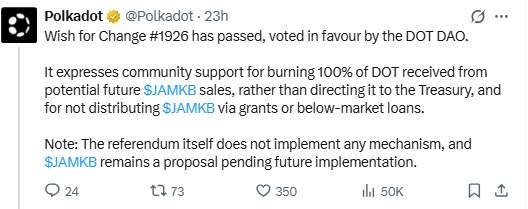
The referendum does not implement a mechanism on its own, but it signals a deflationary lean in how the community wants future token flows handled.
Is the Derivatives Market Confirming This Move?
Derivative data adds context. According to Coinglass data, DOT is up 2.82% over 24 hours, 10.46% over seven days, and 15.07% over the past month, though 90-day and 180-day windows stay deeply negative at -28.14% and -45.51%.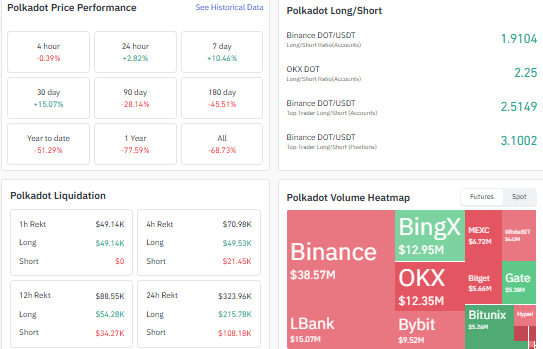
Long/short ratios are skewed heavily bullish, with top Binance traders running a ratio above 3 by position size.
That skew came at a cost: 24-hour liquidations totaled roughly $323,960, mostly on longs, with futures activity concentrated on Binance.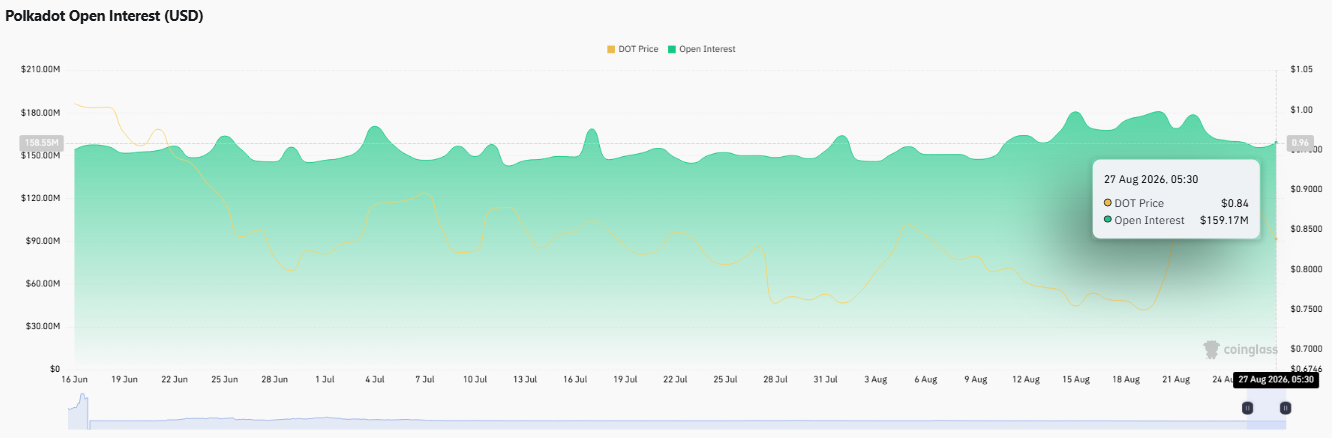
Open interest has climbed to about $159.17 million, near its highest level in weeks.
How Is DOT's Supply Distributed On-Chain?
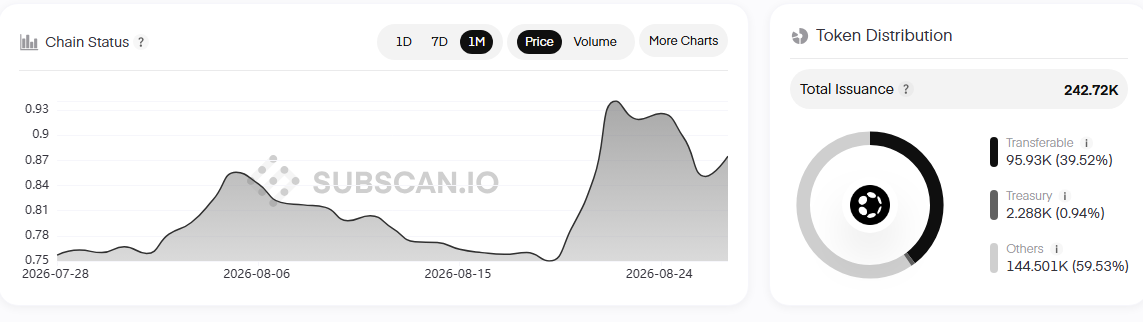
On-chain issuance data from Subscan splits DOT current supply into three buckets: about 39.52% transferable, 0.94% held in the treasury, and the remaining 59.53% under other allocations such as staking and reserves.
What Could Happen Next for DOT?
Before getting to DOT's daily chart, here is how different Polkadot price prediction scenarios could play out from here.
Outlook | Trigger | Key Levels |
Bullish | Daily close holds above 0.8704 and clears the consolidation zone | 0.8704 -> 1.0394 -> 1.1844 |
Neutral | Price consolidates inside the recent range | 0.8704 - 1.0394 |
Bearish | The daily close breaks back below support | 0.7964 -> 0.7273 |
Can DOT's Daily Chart Confirm Its Channel Breakout?
The clearest read comes from the daily chart. DOT broke out of a multi-month falling channel with a large green candle last session, and per the TradingView chart, price now rests just above support at 0.8704, digesting that move before its next direction.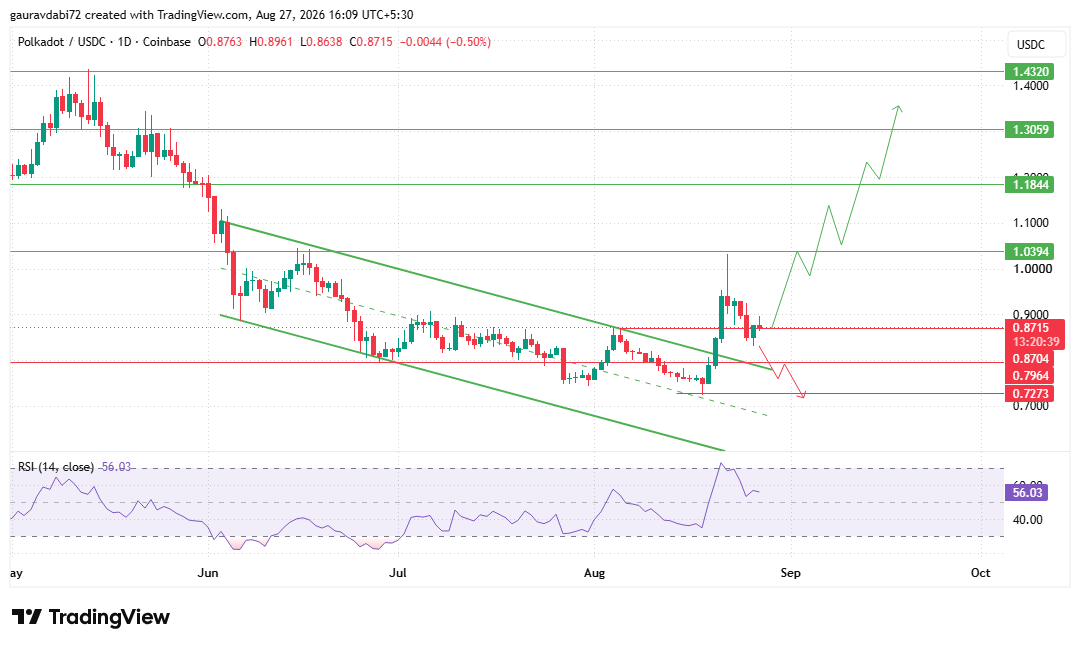
A daily close holding above 0.8704 keeps the setup constructive, with 0.8704 to 1.0394 the range to watch before a move toward 1.1844 becomes relevant.
Losing 0.8704 on a closing basis shifts focus to 0.7964 and then 0.7273.
The 14-day RSI reads 56.03, neutral to mildly bullish after climbing off its recent lows, consistent with a market cooling without turning bearish.
What Does the Analyst Make of This Setup?
As per the CoinGabbar analyst, a channel breakout attempt, long-skewed but liquidation-tested positioning, and a deflationary-leaning governance vote give this Polkadot price prediction a constructive backdrop, though it only turns decisive once a daily close clears 0.8704.
Disclaimer: This article is for informational purposes only and does not constitute financial, investment, or trading advice. Cryptocurrency markets are highly volatile and unpredictable; readers should conduct their own research before making any decisions. CoinGabbar and the author bear no responsibility for losses incurred based on this content.
Also read:

















