Pudgy Penguins Price Prediction 2027: Can $PENGU Reclaim Its Highs?


Pudgy Penguins is one of the very few NFT-linked brands that actually broke out of crypto Twitter and into real retail shelves, and that crossover is exactly why the question keeps coming up.
What does a realistic Pudgy Penguins price prediction 2027 look like once you set the hype aside?
Right now PENGU is trading close to $0.0061, hovering near a multi-month low, but a few things are shifting under the hood that are worth walking through, starting with the liquidation data, because that's usually where the truth shows up first.
Community Sentiment Is Still Bullish
Before getting into the numbers, it's worth noting where community sentiment currently sits.
A recent post from a crypto account on X put it simply: Pudgy Penguins keeps expanding into new markets and finding new ways to reach people.
Source: Data Taken From X
$PENGU, as the ecosystem token, is framed as the best way to ride that growth. It's the kind of long-term conviction you see a lot in this space, built on brand momentum rather than chart levels.
That's an important distinction to keep in mind, because the actual price data tells a more cautious short-term story than the sentiment does.
What the Liquidation Numbers Are Actually Saying
Liquidations don't lie the way tweets do. They're forced exits, real money getting wiped, so they tell you who's actually in pain right now.
Over the last 24 hours, PENGU longs got liquidated for $64.42K, while shorts only lost $9.99K. That's roughly six times more damage on the long side. Shrink the window, and the pattern repeats. 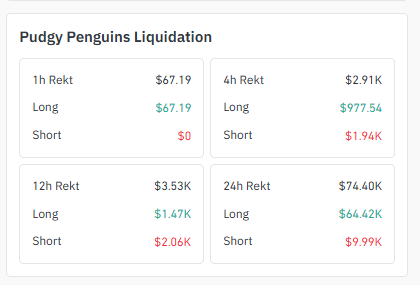
Source: Liquidations Data Taken From Coinglass
In the last 12 hours, it was $1.47K in long losses against $2.06K on shorts, and over 4 hours, longs bled $977.54 versus $1.94K for shorts.
The only exception is the most recent hour, where longs lost $67.19 and shorts lost nothing at all, which could just mean the selling pressure is finally cooling off.
Either way, the bigger picture is clear: people betting on a bounce have been getting burned more than people betting against it, and that kind of imbalance usually means the bottom isn't fully in yet, even if a short-term recovery is starting to take shape.
The Volume Heatmap Shows Where the Real Action Is
The exchange heatmap tells a different story, not about direction, but about where liquidity is actually sitting.
Binance is running the show here with $24.45M in futures volume, more than OKX, BingX, and Bybit combined, and those three sit fairly close together at $8.86M, $8.78M, and $8.08M, respectively.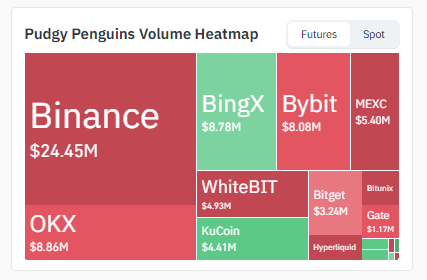
Source: Heatmap Data Taken From Coinglass
Below that you've got MEXC at $5.40M, WhiteBIT at $4.93M, and KuCoin at $4.41M, with Bitget, Gate, Bitunix, and Hyperliquid making up the smaller slices.
When one exchange holds this much of the volume, it usually means moves happen faster and cleaner once momentum picks a direction; there just isn't enough liquidity scattered elsewhere to soften a sharp breakout or breakdown.
Daily Chart: The Descending Trendline Is Finally Being Tested
Here's the part that actually matters for near-term structure.
PENGU has been trapped inside a clean descending trendline since May, printing lower high after lower high all the way from above $0.0110 down to where it's sitting now.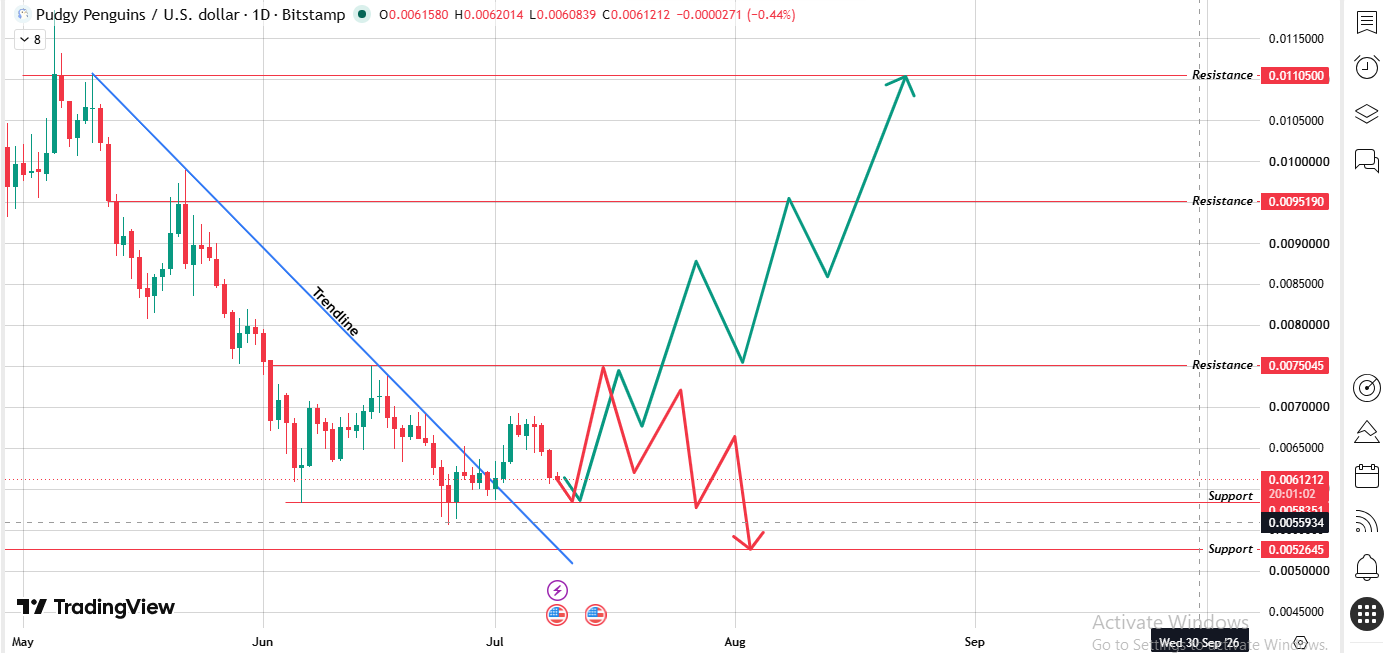
Source: Chart Taken From TradingView
Classic downtrend. But over the last few sessions, price has pushed up against that trendline and started to break through it for the first time since the whole move started.
A trendline break by itself doesn't guarantee anything, but paired with price holding above the $0.0058–0.0056 support zone, it does open the door for a bullish scenario.
If PENGU trade above that trendline and hold the first resistance band near $0.0075, the next stops on the daily chart are $0.0095 and then $0.0110, the exact zone price collapsed from back in May.
Daily Chart – Key Support & Resistance Levels
| Level Type | Price | Notes |
|---|---|---|
| Resistance 3 | $0.0110500 | Breakdown origin from May, major target if trend flips |
| Resistance 2 | $0.0095190 | Mid-range hurdle before the bigger move |
| Resistance 1 | $0.0075045 | The first test trendline break needs a close above this |
| Current Price | $0.0061212 | Sitting right on the descending trendline |
| Support 1 | $0.0058351 | Immediate floor, needs to hold for the bullish case |
| Support 2 | $0.0052645 | Losing this invalidates the reversal setup |
Weekly Chart: Sitting Right on an Ascending Trendline
The weekly view is a bit more layered. PENGU is down 9.89% for the week, opening near $0.0068 and closing around $0.0061, still under pressure zoomed out.
But there's an ascending trendline running underneath price since the earlier lows, and it's currently sitting almost exactly where the price is trading right now. 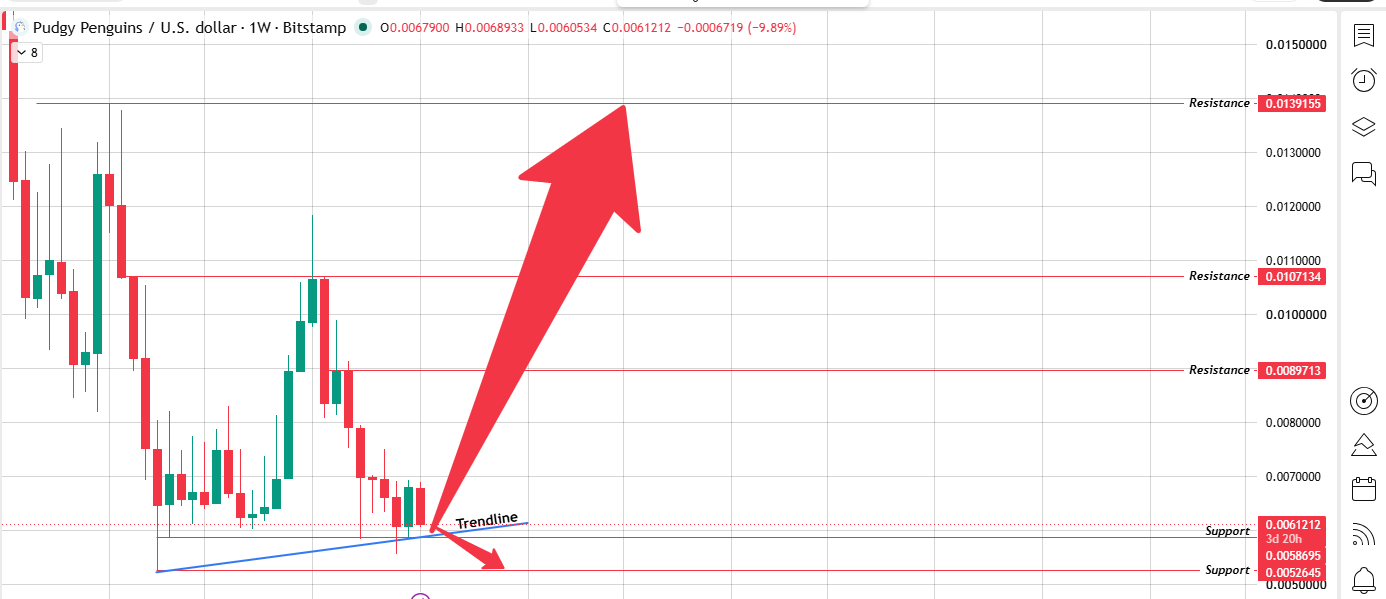
Source: Chart Taken From TradingView
That trendline has caught every dip through this bottoming phase so far, so this is a real decision point: either it holds and price grinds up into resistance or it snaps and PENGU heads back down toward $0.0052.
Weekly Chart – Key Support & Resistance Levels
| Level Type | Price | Notes |
|---|---|---|
| Resistance 3 | $0.0139155 | Major long-term ceiling; needs weeks of buying to reach |
| Resistance 2 | $0.0107134 | Mid-term target if momentum sustains |
| Resistance 1 | $0.0089713 | First real hurdle on the weekly timeframe |
| Current Price | $0.0061212 | Price sitting directly on the rising trendline |
| Support 1 | $0.0058695 | Closest cushion below current price |
| Support 2 | $0.0052645 | Trendline invalidation zone if broken |
But the fact that buyers have defended this rising trendline more than once adds some weight to the idea that a bottom is actually forming, rather than this just being a pause before more downside.
A Rough 2027 Target Range
If you're looking for a number, here's a purely speculative range based on how the current structure could play out over a few years rather than any real forecasting model.
Bear case: If PENGU loses the trendline support and the broader NFT/meme-coin sector stays cold, the price could stay stuck somewhere in the $0.003–$0.008 band.
Base case: If the current bottoming pattern holds and the ecosystem keeps expanding the way it has been, a move back into the $0.015–$0.03 range by 2027 isn't unreasonable.
Bull case: If crypto sees another full market cycle and Pudgy Penguins keeps its retail momentum going, $0.05+ becomes possible.
These aren't targets to trade off of; they're just rough zones based on extrapolating the current chart structure and general market cycles, and a lot can change between now and 2027.
So What About 2027?
Honestly, none of these charts can tell you where PENGU sits in 2027; that's just too far out for daily or weekly technicals to have any real say.
What the data does show is a market testing the edges of a long downtrend, with longs still taking more pain than shorts and liquidity heavily parked on one exchange.
A real multi-year prediction for Pudgy Penguins depends way more on things outside the chart: how far the physical toy and retail expansion goes, new brand deals, where the broader crypto cycle is by then, and whether $PENGU's utility actually grows alongside the IP.
What's on the chart right now is just an early signal of a possible trend shift; nothing is guaranteed yet.
Disclaimer: This article is for informational purposes only and does not constitute financial advice. Cryptocurrency markets are highly volatile, and long-term price predictions carry significant uncertainty. Always do your own research before making investment decisions.
Also read:












.webp)




