XRP Price Prediction: Can the $13 Target Survive XRP ETF Outflows?


$XRP is sitting near $1.09 today, and the coin is once again caught between two very different stories. One chart points to a potential long-term target near $13, while fresh XRP ETF outflows are raising questions about institutional demand.
The latest XRP ETF data shows a net outflow of $7.29 million, creating a short-term headwind for the market. At the same time, a widely followed double-bottom setup suggests it could eventually target much higher Fibonacci levels if the broader crypto cycle turns bullish.
Let's discuss the XRP Price Prediction 2026, including the latest ETF data, derivatives positioning, technical structure, and key support and resistance levels.
What is the $XRP price today?
The altcoin trades around $1.09, down slightly over the past 24 hours. The token's market cap sits near $68.23 billion, with futures open interest at $2.34 billion, up 0.73% on the day.
Spot volume over 24 hours came in at $333.71 million, while futures volume hit $1.95 billion. The difference suggests traders are currently more active in leveraged positions than in direct spot buying.
This makes XRP trading volume an important metric to watch. A bullish breakout without stronger spot volume could struggle to sustain momentum, while rising spot activity alongside price strength would provide better confirmation.
Is $XRP forming a double bottom on the monthly chart?
A widely shared chart from crypto analyst EGRAG points to a potential double-bottom formation below what the analyst calls the "Super Guppy," a cluster of moving averages used to track the macro trend.
The idea is that it has formed similar bottom structures before earlier cycle expansions. According to the shared roadmap, the projected Fibonacci levels are:
| Fibonacci Zone | Price Target |
| Early reclaim zone | $1.42 |
| Major macro resistance | $3.59 |
| Expansion zone | $5.41–$6.69 |
| Fib 1.618 | $9.09 |
| Upper projection | $13.82 |
The analyst frames this as a long-term projection rather than a short-term target. Past bottom formations took months or even years to fully develop.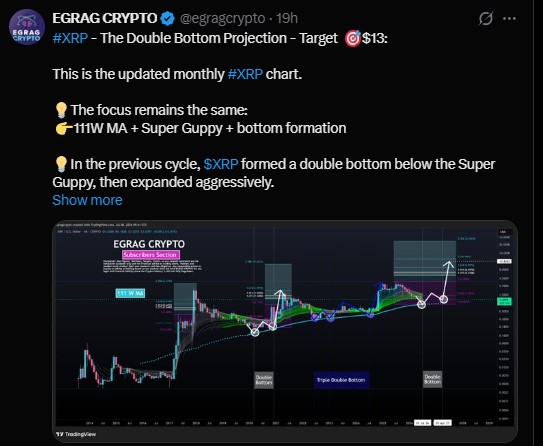
The $XRP Fibonacci levels therefore provide a framework rather than a guarantee. If the double-bottom structure confirms, the $1.42 reclaim would be an early signal, while $3.59 becomes a much more important macro resistance zone.
Why are $XRP futures traders leaning short?
Liquidation data tells a mixed story depending on the timeframe. Over the past hour, shorts took the bigger hit, losing $44.43K compared with zero on the long side.
Over four hours, however, longs lost $65.61K while shorts lost $563.11K. The 24-hour data showed $3.09 million in long liquidations against $883.17K in short liquidations.
In simple terms, more long positions have recently been forced to close as price struggled to move higher.
Exchange positioning adds another layer. Binance's XRP/USDT long/short account ratio sits at 2.8081. Binance top traders show a ratio of 3.279 by account count and 1.6055 by position size, while OKX reports a ratio near 2.93.
This means accounts remain heavily tilted toward longs even as price action stays weak. That imbalance can create additional volatility if it suddenly breaks either side of the current range.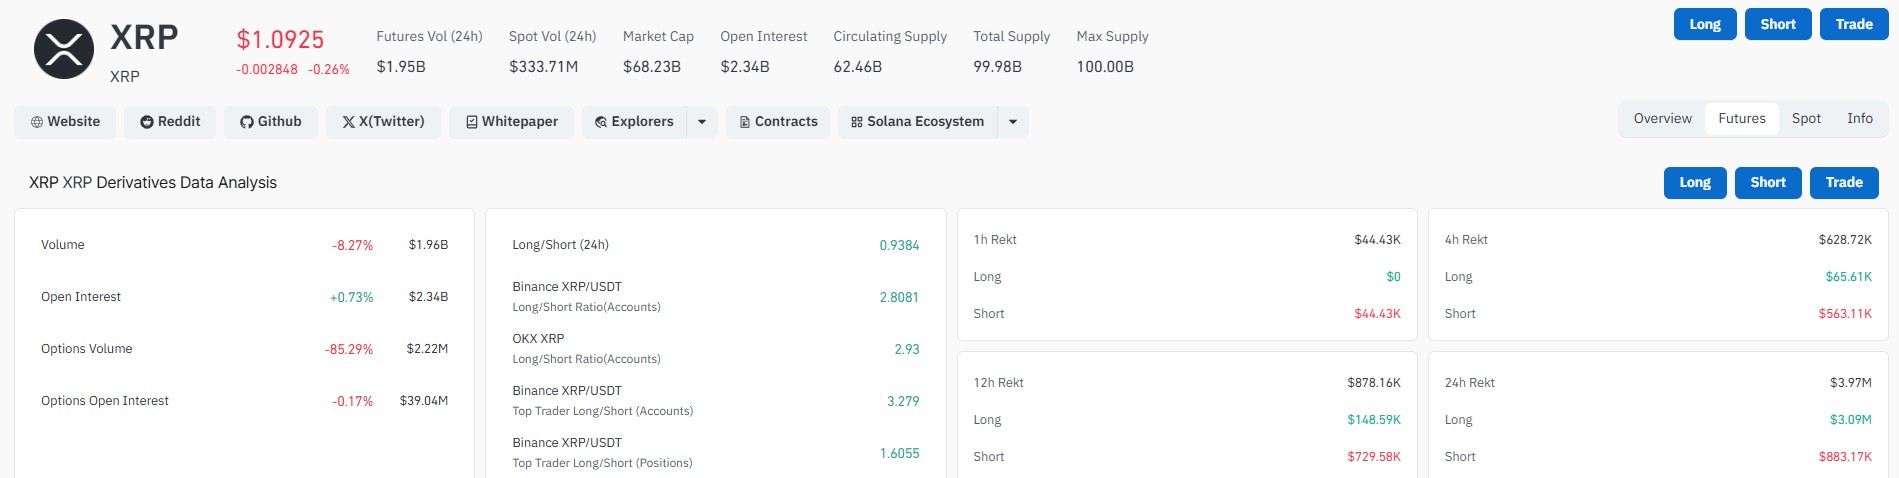
$XRP ETF Outflows: What Is Happening With Institutional Demand?
Spot XRP ETFs recorded a net outflow of $7.29 million, based on SoSoValue tracking.
That breaks a streak of positive weeks highlighted in previous reports, when ETFs recorded eight consecutive weeks of inflows totaling around $1.49 billion cumulatively.
One week of outflows does not erase months of institutional demand. However, the latest XRP ETF outflows analysis raises an important question: can institutional buying continue strongly enough to support a move toward the higher Fibonacci targets?
For the latest XRP ETF news, investors should track weekly net flows rather than focusing on a single session. A return to sustained inflows would strengthen the bullish thesis, while consecutive weeks of outflows could signal weakening demand.
The current ETF-versus-price relationship is also important. If the price remains stable despite ETF outflows, it could indicate that other buyers are absorbing institutional selling. If price falls sharply alongside accelerating outflows, the bearish signal becomes stronger.
What other $XRP news could move the price?
The $XRP Ledger's v3.2.0 upgrade has crossed a key threshold, with more than 55% of trusted validators running the new software.
The XRP Ledger's v3.2.0 upgrade brings infrastructure improvements, security fixes, and developer tools. Full activation still requires more than 80% validator approval for two consecutive weeks.
Tokenized real-world assets on the XRP Ledger have also reportedly grown sharply, rising from $150 million to more than $4 billion in a year, according to Evernorth.
However, this figure needs context. Roughly $2.2 billion is reportedly linked to a single energy token held by only 19 wallets. Around $385 million is described as genuinely held on-chain and actively traded.
This means the headline RWA growth figure should not automatically be interpreted as equivalent to liquid economic activity.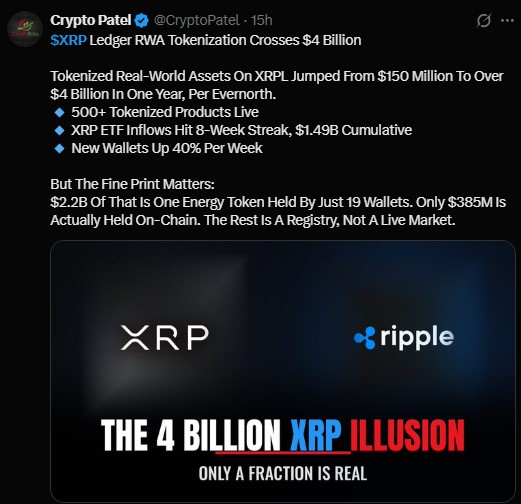
What are the key $XRP support and resistance levels?
| Level | Price | Significance |
| Major Resistance | $1.20 | Key short-term reclaim zone |
| Early Breakout | $1.42 | Double-bottom confirmation area |
| Current Zone | $1.00–$1.09 | Immediate trading range |
| Major Support | $1.00 | Psychological support |
| Lower Support | $0.80 | Potential downside target |
The $1 level remains the line in the sand. A daily close below it could open the door toward $0.80. Readers tracking XRP support and resistance levels should focus on closing prices and volume confirmation rather than temporary intraday wicks.
On the upside, it needs to reclaim the $1.18–$1.20 region to improve short-term momentum. A stronger move above $1.42 would provide additional confirmation for the longer-term double-bottom thesis.
$XRP Technical Model: What Indicators Matter?
The current technical model combines $XRP RSI, EMA and moving averages, trading volume, MVRV context, and ETF flows. RSI helps identify momentum conditions, EMA and moving averages define the broader trend, volume confirms the strength of breakouts, while MVRV can provide additional valuation context. ETF flows are used as a measure of institutional demand rather than as a standalone price predictor.
At present, the model remains mixed. The long-term double-bottom setup is potentially bullish, but weak spot volume, recent ETF outflows, and long-heavy derivatives positioning create near-term risks.
This is why the current analysis today is more balanced than the headline $13 target suggests.
XRP Price Target: Bull, Base, and Bear Scenarios
| Scenario | Price Target | Key Assumption |
| Bear Case | $0.60–$0.80 | ETF outflows continue and $1 support fails |
| Base Case | $1.20–$3.59 | It stabilizes and gradually recovers |
| Bull Case | $5.41–$9.09 | Double bottom confirms and crypto cycle strengthens |
| Extreme Bull | $13.82 | Major cycle expansion and strong institutional demand |
These probabilities are scenario estimates, not guaranteed outcomes. The $13.82 projection remains a high-risk, long-term scenario that depends on confirmation of the broader market structure and sustained institutional demand.
$XRP Forecast: Can the $13 Target Survive?
The $13.82 target represents a multi-year, best-case Fibonacci extension tied to a potential double-bottom structure. It is not a prediction that XRP will reach $13 in the near term.
EGRAG's broader cycle view includes targets extending toward the $7–$10 region, while Standard Chartered has previously cited a much more conservative ~$2.80 base case. These forecasts demonstrate how widely XRP price target estimates can differ based on assumptions.
The key distinction is timeframe. The $1–$1.20 range matters for the $XRP price prediction today and XRP price prediction this week, while the $5–$13 targets depend on a much longer cycle expansion.
For investors asking will XRP go up tomorrow, the answer depends on whether $1 support holds and whether spot volume improves. For those asking is $XRP a good buy right now, the risk-reward depends on individual tolerance for further downside and the ability of it to reclaim key resistance levels.
The bigger question is whether it is bullish or bearish. Right now, the short-term structure remains cautious, while the long-term chart offers a potential bullish scenario if the double bottom confirms.
Bottom Line: Where Does XRP Go From Here?
The latest XRP ETF outflows create a near-term challenge for the bullish thesis, but one week of negative flows does not invalidate the broader institutional adoption story.
The immediate battle is between $1 support and the $1.18–$1.20 resistance zone. A reclaim of $1.42 would strengthen the double-bottom structure, while a sustained break below $1 could expose the $0.80 area.
For the broader XRP price prediction 2026, traders should watch ETF net flows, XRP trading volume, RSI, moving averages, and major Fibonacci levels together rather than relying on a single indicator.
The $13.82 projection remains a high-risk, long-term scenario. It requires the current bottom structure to confirm, the broader crypto market to enter a strong expansion phase, and institutional demand to remain supportive.
For now, the $1–$1.20 range is far more important for near-term price action than the headline $13 target. The next decisive breakout could determine whether XRP remains trapped in its current range or begins building the foundation for a much larger cycle move.
Disclaimer
This article is for informational purposes only and does not constitute financial, investment, or trading advice. Cryptocurrency markets are highly volatile, and prices can change rapidly. Past performance and chart-based projections do not guarantee future results. Always conduct your own research and consult a licensed financial advisor before making any investment decisions.












.webp)




