Vanar Chain Price Prediction: $VANRY Soars on Exchange Listings


A small gaming linked token just woke up the entire altcoin corner of the market. Traders who ignored it a week ago are now refreshing charts every few minutes. What actually pushed it here, and does it have any legs left? That is the part most headlines are skipping.
What Is Driving The Sudden VANRY Price Explosion Today
Vanar Chain price prediction searches have spiked after VANRY tore through its recent range in a single session. Basically, a token that was quietly consolidating for weeks turned into the loudest name on crypto trading desks overnight.
But here is what most casual observers are missing. This move did not start from nowhere; it started from a base that had been building pressure for weeks.
And that raises a question worth sitting with for a second: how much of this is real demand, and how much is leverage chasing leverage?
Vanar Chain VANRY Coin Overview and Today's Trading Snapshot
| Metric | Detail |
|---|---|
| Coin Name | Vanar Chain |
| Ticker Symbol | VANRY |
| Blockchain | Vanar Chain (Layer 1, EVM compatible) |
| Today High | $0.009572 |
| Today Low | $0.005012 |
| RSI Level | 89.02 (deeply overbought) |
| Token Type | Native utility and gas token |
| Token Category | Layer 1, gaming, AI infrastructure |
| Market Cap | $20.22 Million |
| 24H Trading Volume Change | +64.29% |
| Circulating Supply | 2.37 Billion VANRY |
| 24H Change | +55.59% |
Source: Data by CoinMarketCap
Vanar Chain Explained In Simple Words For New Investors
Vanar Chain started life as Virtua, a project built around web3 gaming and the metaverse. It later rebranded to Vanar, shifting its focus toward an AI-native Layer 1 chain built on Ethereum's foundation, aimed at gaming, entertainment, and real-world data storage.
VANRY is the gas token that powers the network. It's used for transaction fees, staking, and governance across the chain.
Why This Small-Cap Token Matters Beyond Just The Hype
This is not a random meme run. Vanar has been building AI tools like Neutron for on-chain data compression and Kayon for on-chain reasoning, a theme we already flagged in an earlier Vanar Chain price prediction covering its Binance volume rally.
The project has also leaned into gaming, with titles like World of Dypians drawing tens of thousands of players onto its infrastructure, part of a broader wave of altcoin market trends tied to gaming and AI narratives.
Vanar Chain Liquidation Data Reveals A Sudden Shift In Positioning
Over the past 24 hours, short sellers took the bigger hit, with $3.18M in short positions wiped out against $1.19M in longs. That lines up with the breakout squeezing anyone betting against VANRY.
But look at the most recent hour. Longs got rekt for $159.30K against just $9.67K in shorts, a sign the crowd chasing this move higher just got punished too.
That flip between the 24h picture and the 1h picture matters. It hints the easy money on this breakout may already be behind us.
Source: Liquidation data by CoinGlass
Fundamental Backdrop Behind The Vanar Chain Price Move
Here's the thing: VANRY was placed under a Binance monitoring tag on July 3, just days before this rally began. That tag does not mean delisting, but it does mean the exchange wants to see stronger fundamentals and liquidity going forward.
So the same week the project faced exchange scrutiny, a fresh derivatives listing sent volume soaring in the opposite direction.
But that contrast alone tells you how fast sentiment can flip in this market, even while the broader Bitcoin price outlook remains relatively steady.
Aster DEX Confirms New VANRY Perpetual Listing With Leverage
A tweet from Aster DEX confirmed new perpetual listings for VANRY and YFI, offering up to five times leverage and 1.2x trading points until July 13, part of a fresh wave of exchange listing news hitting small-cap tokens this month.
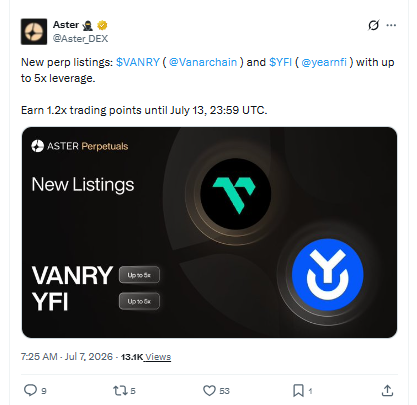
Source: Posted on X by Aster_DEX
Coinstore Also Lists VANRY Futures As Momentum Builds
Coinstore followed with its own futures listing for VANRY, offering leverage up to 50x and noting the token had surged over 150% across three days on their platform.
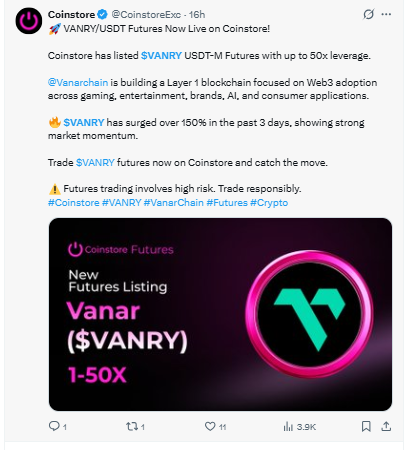
Source: Posted on X by CoinstoreExc
Vanar Chain Technical Price Analysis Breaking Down Today's Chart
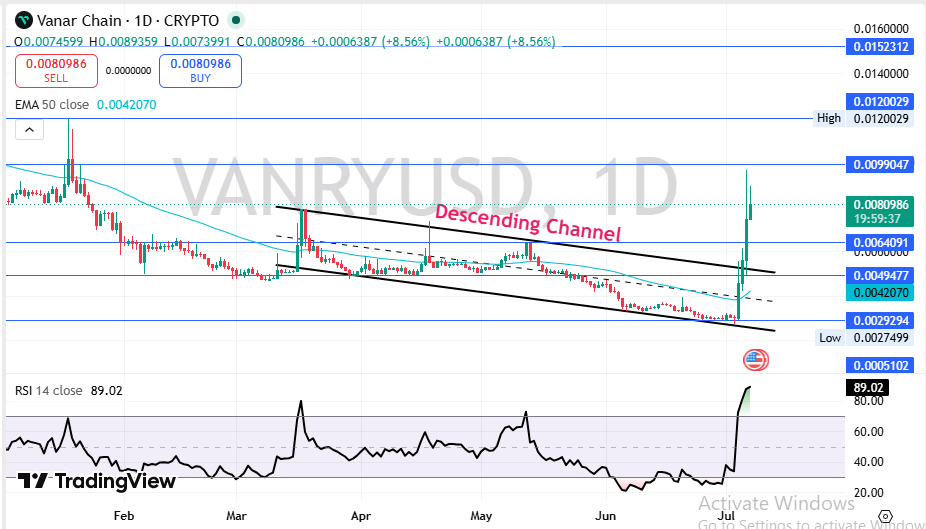
Buyers took full control here. On the daily chart, price broke clean out of a descending channel that had capped VANRY since March, and volume confirmed the move instead of just noise.
Source: Charting by TradingView
The 50 EMA sits near $0.0042, and the price is trading well above it. That gap alone confirms the short-term trend has flipped bullish.
RSI is sitting at 89.02. That is extreme. It does not guarantee an immediate reversal, but it does mean a cooling period is overdue.
Immediate resistance sits at $0.009905, with the next major wall up at $0.012003.
Support below sits at $0.006409, then $0.004948, which also acts as the invalidation zone for this bullish structure.
Where Is Vanar Chain Trading Volume Actually Coming From
Binance alone is dwarfing every other venue right now, and the spread below shows just how lopsided it is.
| Exchange | 24H Spot Volume |
|---|---|
| Binance | $736.13M |
| LBank | $301.57M |
| Bybit | $127.18M |
| Bitget | $59.65M |
| Gate | $46.68M |
| KuCoin | $27.55M |
That concentration matters given VANRY's recent monitoring tag on Binance. Liquidity is still deep there for now, and that is exactly the exchange regulators and the project need to keep happy.
Source: Volume heatmap by CoinGlass
How Vanar Chain Stacks Up Against Other Small Cap Movers
Compared to majors like the current Ethereum price outlook, this is a much smaller cap token, so percentage swings naturally look larger.
Majors stayed comparatively calm through this, and that gap alone suggests this is a sector-wide leverage story rather than a Vanar-only event.
Vanar Chain Short-Term Price Prediction For The Coming Weeks
Momentum favors continuation in the short term, but an overbought RSI this extreme usually forces at least a partial cooldown before the next leg.
| Timeframe | Bearish Target | Base Target | Bullish Target | Key Trigger |
|---|---|---|---|---|
| 24 Hours | $0.00700 | $0.00810 | $0.00957 | Reaction to the Aster listing hype cooling off |
| 3–7 Days | $0.00650 | $0.00850 | $0.01050 | Whether trading volume stays above $100M daily |
| 2–4 Weeks | $0.00500 | $0.00780 | $0.01200 | End of the Aster trading points promotion on July 13 |
Watch the volume closely once the trading incentive period ends.
Vanar Chain Long-Term Price Outlook Through Next Year
Zooming out, VANRY still sits far below its 2021 all-time high near $1.22, and closing that gap needs far more than one listing-driven rally.
| Timeframe | Bearish Target | Base Target | Bullish Target | Catalyst Needed |
|---|---|---|---|---|
| 3 Months | $0.0035 | $0.0075 | $0.0130 | Sustained developer activity on Neutron and Kayon |
| 6 Months | $0.0025 | $0.0090 | $0.0180 | Resolution of the Binance monitoring tag review |
| End of Year | $0.0020 | $0.0110 | $0.0250 | New gaming partnerships driving real usage |
| 2027 Outlook | $0.0015 | $0.0140 | $0.0400 | Broader AI narrative pulling capital into infrastructure tokens |
The long-term case is not weak, but it is fragile. It depends heavily on Vanar clearing its exchange scrutiny and proving real adoption beyond token incentives.
Three Price Scenarios Traders Should Prepare For Now
Worst Case: The Aster incentive ends, leverage unwinds fast, and price slides back under $0.005.
Base Case: Price consolidates between $0.006 and $0.010 while the market digests this move.
Best Case: Volume stays elevated, a fresh partnership lands, and VANRY pushes toward $0.012 and beyond.
| Scenario | Price Range | What Triggers It |
|---|---|---|
| Worst Case | Below $0.0050 | Leverage unwind after incentive ends |
| Base Case | $0.0060 to $0.0100 | Sideways digestion of recent gains |
| Best Case | Above $0.0120 | Fresh volume and ecosystem news |
Key Vanar Chain Price Levels Every Trader Should Watch
Resistance zone: $0.009905 and, above it, $0.012003, both capping further upside for now.
Support zone: $0.006409, the first real cushion if profit-taking accelerates.
Invalidation zone: $0.004948; a close below this would undo the entire bullish channel breakout story.
Analyst View And Final Thoughts On The VANRY Rally
When we pulled up the daily chart, the first thing that stood out was just how sharp this breakout candle looked against weeks of quiet consolidation. That is not normal price action for a small cap.
But an RSI above 89 is not something to brush aside. It's one of the most stretched readings this token has printed all year.
A weekly close holding above $0.0080 would say buyers are serious about defending this breakout. Losing that level fast would say the move was mostly leverage chasing a headline.
One factor worth tracking beyond the chart itself is broader market mood, and checking the crypto Fear and Greed Index alongside this setup gives useful context on how much risk appetite is actually out there.
Two, remember the Aster incentive expires July 13. That date matters more than most people realize right now.
The most important level on the board stays $0.006409. Hold that, and the bullish story survives.
Lose it. And the whole descending channel breakout starts looking like a trap instead of a trend change.
For more setups like this across the market, our full crypto price predictions hub tracks these levels daily.
Disclaimer: This article is for educational purposes only and does not constitute financial advice. Crypto markets are volatile. Consult your investment advisor before making any investment decision.
Also read:










.webp)






