SCOR Price Prediction: What's Behind Today's Surge


SCOR Price Prediction: Why Is SCOR Surging Today?
A sudden double-digit jump can make a lot of people ask the same question at once: Is this the start of something bigger, or just noise before another drop? That's exactly what's happening with $SCOR right now, and the SCOR price prediction conversation has picked up fast as traders try to figure out which one it is. Nobody saw this coming a week ago.
Some coins move on hype. Others move because something in the chart quietly shifted first, and only later does the reason catch up. $SCOR looks like the second kind, at least so far, and it's worth asking whether this fits the pattern behind why crypto is rallying more broadly right now.
There's a pattern forming here, one that's been building for months, not days. And the token's supply setup adds a layer most people scrolling past the price chart won't even notice. But is any of it enough to change the bigger trend, the way a Bitcoin price forecast sets the tone for the rest of the market? That question is worth sitting with for a minute before jumping to conclusions.
So what's actually driving this move, and does it hold up once you look past the green candle? Keep that in mind as we go through the data.
Current price snapshot
Per the CoinMarketCap SCOR listing:
| Metric | Value |
|---|---|
| Price | $0.01412 |
| Contract Address (Base) | 0xD67EC255100Ef200A439D09FF865fbAA2Ad9C730 |
| 24h Change | +26.55% |
| Market Cap | $5M |
| 24h Volume | $356.62K (+19.93% vs prior day) |
| Volume / Market Cap | 7.15% |
| FDV | $56.48M |
| Liquidity / Market Cap | 1.41% |
| Circulating Supply | 354.79M SCOR |
| Total / Max Supply | 4B SCOR |
| Holders | 4.53K |
| All-Time High | $0.06405 (Dec 17, 2025, down 78% from ATH) |
| All-Time Low | $0.00606 (Jan 28, 2026, up 132% from ATL) |
The gap between circulating supply (354.79M) and total/max supply (4B) is large; under 9% of total supply is currently circulating. That matters more than the price move itself, and it's the kind of detail that separates a real altcoin price prediction from one built on the chart alone.
Technical Analysis: What the charts show
Daily chart (SCORUSDT, Bybit via TradingView): price has been inside a descending channel since mid-June, with resistance zones stacked at $0.01656, $0.01971, and $0.02327 and support around $0.01064. The 50 EMA is at $0.01398, just under the current price, and the daily RSI is at 57.84, a recent, fairly sharp bounce off the lower channel boundary. 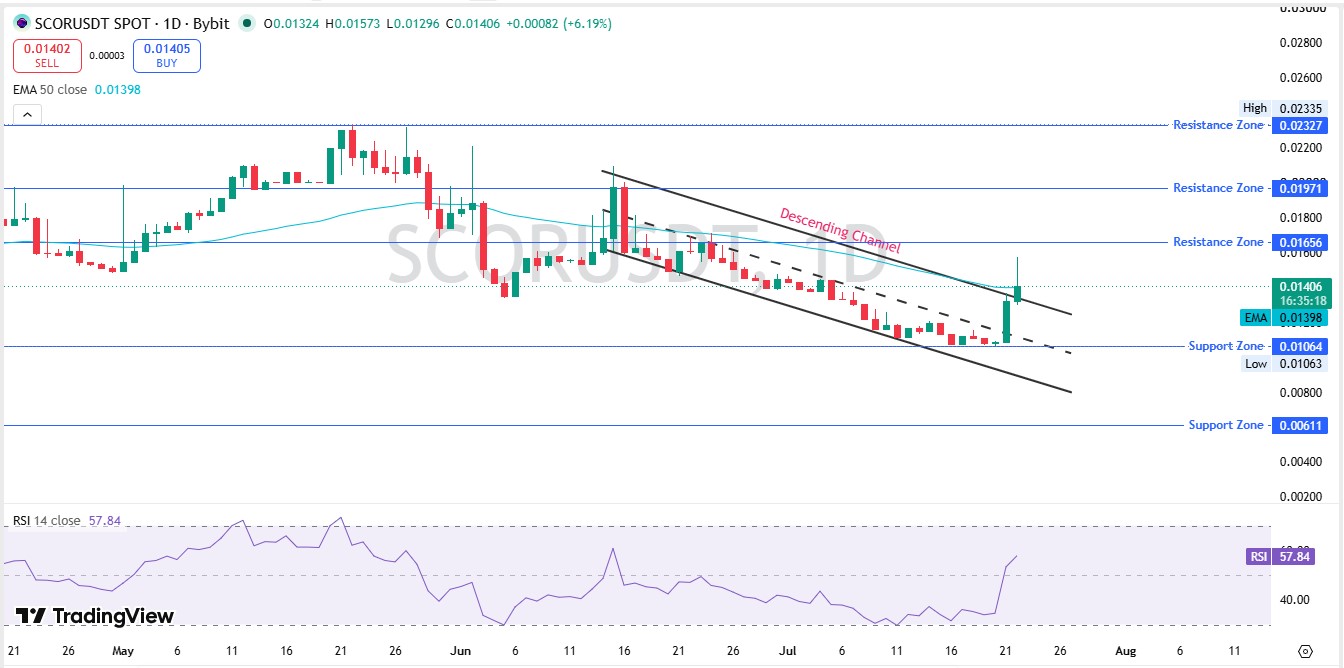
A move like this, right off support and back above the short-term moving average, is worth noting on its own, similar to how a Solana bullish flip gets read on its own chart before anyone calls a trend reversal. But one green candle doesn't break a multi-week downtrend by itself. The chart doesn't lie about the bigger picture: SCOR is still down sharply from its ATH and has spent months making lower highs.
Weekly chart (SCORUSDT, Bybit, via TradingView): price is sitting inside a descending triangle that's been forming since roughly March 2026, with resistance sloping down toward a support zone around $0.01064 and a secondary, deeper support zone around $0.00611. 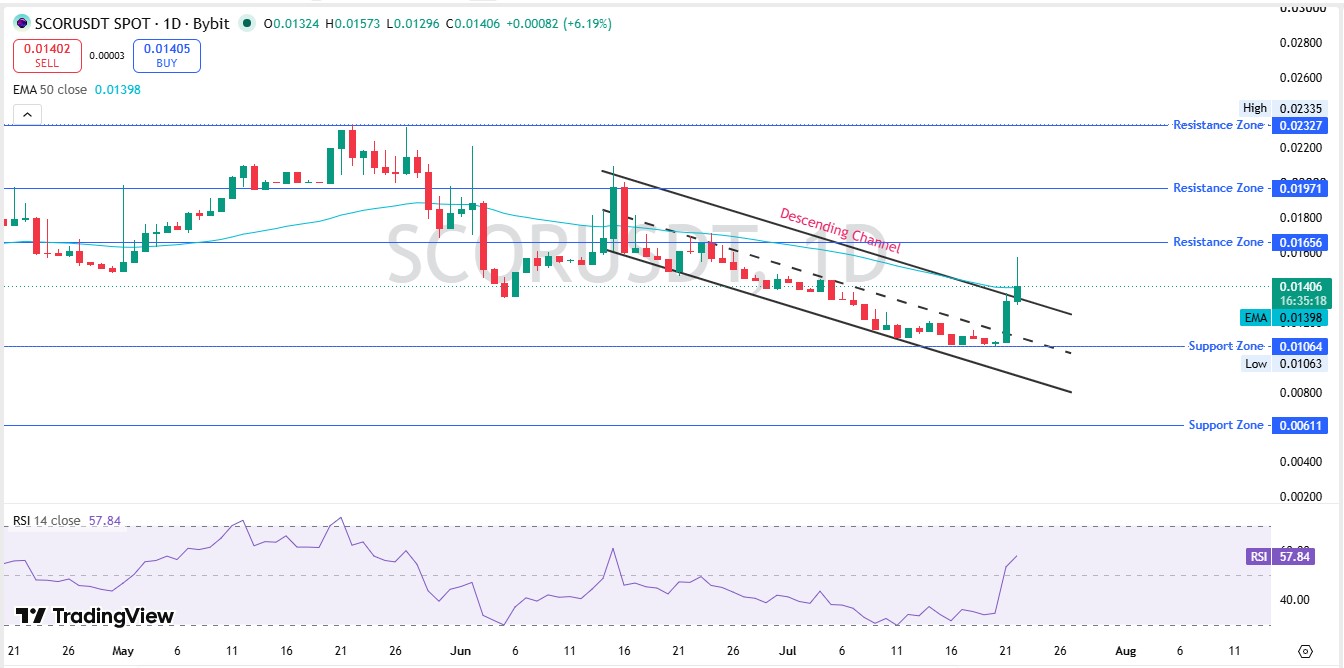
The most recent weekly candle is up nearly 30% and is still forming, not closed yet. A descending triangle with flattening support and a declining upper trendline is typically read as a continuation-or-breakdown pattern until price actually closes above the trendline; this one hasn't done that yet. Weekly RSI sits near 50, which is neutral, not overbought or oversold.
What would change the read? A daily or weekly close above the descending triangle's upper trendline (roughly the $0.017–0.02 zone depending on where price sits when that happens) would be the first real signal the downtrend is losing control, the same kind of confirmation traders look for after an XRP resistance rejection plays out on a bigger chart. A daily close back below $0.0106 would suggest the recent bounce was just noise inside a still-intact downtrend, with the next real support to watch around $0.006.
Tokenomics: why the small circulating supply matters here
From the SCOR whitepaper excerpts provided:
-
Total fixed initial supply: 4 billion SCOR.
-
Allocation: 45% (1.8B) Ecosystem Reserve, 15% (600M) Private Sales, 15% (600M) Treasury, 15% (600M) Core Team & Contributors, 5% (200M) Strategic Advisors, 5% (200M) Foundation Endowment.
-
The whitepaper states that at launch, less than 12% of total tokens were expected to be in circulation, which lines up with the current circulating figure of roughly 8.9% of total supply.
That's a meaningful supply overhang. Team, private-sale, advisor, and treasury allocations that aren't yet circulating represent future unlock risk; if and when those tokens vest and hit the market, they can put sustained sell pressure on price regardless of what the chart looks like beforehand.
Nothing in the material provided specifies an exact unlock schedule or vesting cliff dates, so that risk can't be quantified further here. It's a real question, not an assumption; anyone tracking this token seriously should look up SCOR's actual vesting schedule directly on the SCOR tokenomics page or cross-check upcoming dates against a broader coin events calendar before treating any bullish chart pattern as the whole story.
The token's actual utility (from the whitepaper)
This part is specific to SCOR, not generic. The whitepaper describes SCOR's Execution Layer running several specialized "cores," including a Fan Engagement Core (FE Core) built to track relationships between athletes, teams, brands, and fans; and a Real-World Data (Oracle) Core meant to bring off-chain sports data, match outcomes, and player stats and standings on-chain to resolve competitions and rewards. There's also a planned Cross-Chain Communication (Bridge) Core, with the project already using LayerZero for multi-chain support, a similar approach to bridging seen across other blockchain ecosystem projects.
On the economic side, $SCOR is designed to serve two purposes: as gas/staking collateral if a dedicated SCOR layer 1 launches and as the "fuel" for a consumptive flywheel at the application level. Per the whitepaper's own breakdown, every on-platform transaction using SCOR triggers a three-way split: 33.3% redistributed to a community rewards bucket, 33.3% permanently burned (until a 1 billion token floor is reached), and 33.3% sent to treasury.
That burn mechanic is a deflationary lever tied directly to actual platform usage, meaning its effect on supply depends entirely on how much real transaction volume the fan-engagement product generates, not on trading activity alone. That's worth separating clearly from the trading-driven price action described above; a burn from product usage and a price pump from spot buying are two different things, and this article isn't in a position to say how active the underlying product currently is.
Bull / base / bear: as scenarios, not signals
These are read-outs of what different chart outcomes would imply, not entry or exit instructions.
Bull scenario: a daily and weekly close above the descending triangle's upper trendline, ideally on rising volume, would open the path toward the $0.01656–0.01971 resistance band and, beyond that, the $0.02327 zone, structured the same way a Bitcoin bull-bear outlook is typically framed. This would need continuation buying, not just the single bounce candle currently on the chart. Invalidation: a daily close back below the $0.01064 support zone.
Base scenario: price continues chopping inside the existing descending channel/triangle, testing both the $0.0106 support and the declining upper trendline repeatedly without a clean break either way, roughly consistent with the past several weeks of price action, the kind of range-bound grind an Ethereum price outlook sometimes goes through before a real trend resumes. Invalidation: a decisive weekly close outside either boundary of the pattern.
Bear scenario: the recent bounce fails to hold above the 50 EMA ($0.01398), price rolls back over, and the descending triangle resolves downward toward the $0.00611 zone, closer to the token's all-time low, a setup not unlike past pullbacks covered in crypto market crash coverage when broader sentiment turns. Invalidation for this case would be a reclaim and hold above $0.01398 on the daily chart for more than one or two sessions.
Where the underlying data comes from
-
Price, market cap, volume, supply, and ATH/ATL figures: CoinMarketCap SCOR data.
-
Chart structure, RSI, EMA: TradingView charts as displayed on Bybit's SCORUSDT spot pair.
-
Contract and on-chain contract-creator info: BaseScan explorer data.
-
Tokenomics, allocation, and protocol architecture: the SCOR tokenomics page (whitepaper Rev. Sep 2025 v1.04).
Final Verdict On SCOR Price Prediction
SCOR is up sharply over the past 24 hours and is showing a real technical bounce off support on both the daily and weekly charts. But it's still trading inside a multi-month descending pattern, still down heavily from its all-time high, and sitting on a token supply where over 90% hasn't entered circulation yet.
None of that makes the bounce meaningless, but it does mean the honest read is "watch for a confirmed trendline break," not "this is going up." That's worth remembering the next time a crypto presale or new listing promises fast gains without the same scrutiny. Anyone trading this should independently verify the contract address, check the actual unlock schedule, and treat the low liquidity here as a real risk to position sizing and slippage, not a footnote.
Disclaimer
This article is for informational purposes only and is not financial, investment, trading, or legal advice. SCOR is a low-liquidity, small-cap token, and its price can move sharply on relatively small trades. All price levels, chart patterns, and bull/base/bear scenarios discussed here are analytical observations based on publicly available data at the time of writing, not predictions, guarantees, or recommendations to buy, sell, or hold.
Cryptocurrency markets are volatile and carry a real risk of loss. Always verify contract addresses, tokenomics, and unlock schedules directly through official project sources before making any decisions, and consider speaking with a qualified financial advisor. Past performance, including any historical highs or lows referenced above, is not indicative of future results.
Also read:

















