SPX6900 Price Prediction July 2026: $SPX Ready for Another Breakout?


Something's coiling, and SPX6900 traders can feel it. Weeks of tightening range action have pushed this token right to the tip of a chart pattern that rarely stays quiet for long.
This SPX6900 price prediction July 2026 lands at a genuinely loaded moment; one timeframe just broke out, and the other is about to.
Current SPX6900 Price and Where It Stands Right Now
SPX6900 is trading around $0.3846 at the time of writing.
That number matters more than it looks; it's sitting almost exactly at the apex of a pattern that's been building on the daily chart for a while and right on the heels of a breakout that already happened on the lower timeframe.
Two setups, converging at once. That doesn't happen every day.
Social Sentiment Check: Traders Are Eyeing a Breakout
Chart watchers on X are showing genuine breakout confirmation conviction right now. A widely shared post from @TriggerTrades flagged SPX6900 for a breakout setup.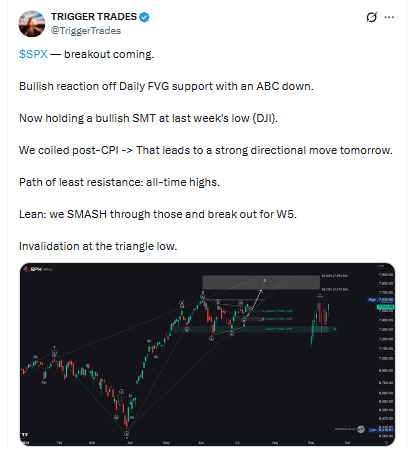
Source: Data Taken From X
A Bullish reaction off daily fair-value-gap support, an ABC correction that's already played out, and a bullish structural shift holding at last week's low.
Their bullish token coiled hard through the post-CPI window, and that kind of compression usually resolves with a strong directional move.
The call is blunt about direction too, a path of least resistance toward all-time highs, with a lean toward smashing straight through them rather than stalling out.
The one line worth flagging for risk management: invalidation sits at the triangle low, which lines up almost exactly with the $0.34486610–$0.31786262 zone on the daily chart.
Confluence between social calls and the chart's own structure doesn't guarantee an outcome, but it's rarely something to ignore either.
SPX6900 Liquidation Data: Shorts Are Getting Squeezed
The liquidation heatmap is telling a story that lines up neatly with the channel breakout, and it's worth watching alongside every price target mentioned above.
In the last hour, $22.20 got liquidated, totaling $15.30 of those longs against just $6.89 of shorts, fairly balanced. 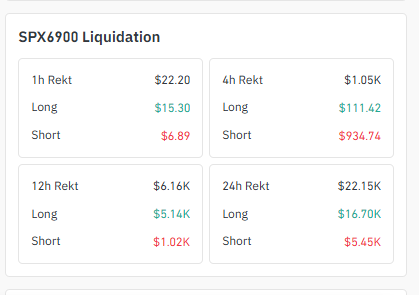
Source: Liquidation Data Taken From Coinglass
But stretch that to the 4-hour window, and the picture flips hard: $1.05K total rekt, and shorts are eating almost all of it at $934.74 against a mere $111.42 in longs.
That's not a small tell. Zoom out to 12 hours, and it's $6.16K total, $5.14K long-side against $1.02K short.
The 24-hour tally lands at $22.15K, split $16.70K long and $5.45K short. So over a day, longs have taken more total damage, consistent with the earlier grind lower.
But that sharp 4-hour damaging, consistent liquidation grind was the moment the channel broke upward. Shorts got caught leaning the wrong way right as the price flipped.
Exchange Volume Heatmap: Where the Futures Action Is
Binance leads SPX6900 exchange volume in futures at $9.06M, with BingX close behind at $6.83M and Bybit at $6.03M. 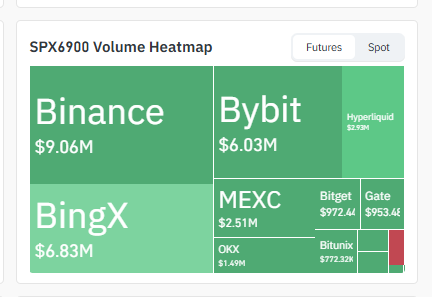
Source: Heatmap Data Taken From Coinglass
MEXC follows at $2.51M, Hyperliquid at $2.93M, OKX at $1.49M, and Bitget ($972.44K) and Gate ($953.48K) rounding out the mid-tier, with Bitunix ($772.32K) and a few smaller venues showing lighter activity.
That much volume sitting on the major exchanges, Binance and Bybit especially, usually means this isn't a thin, easily manipulated move. Real size is behind the current price action.
4H Chart: Descending Channel Already Broken to the Upside
Here is the part that changes the tone of this whole setup. The 4-hour chart had been carving out a descending channel for weeks, with lower highs and lower lows stacking neatly inside parallel rails, and that channel has already broken.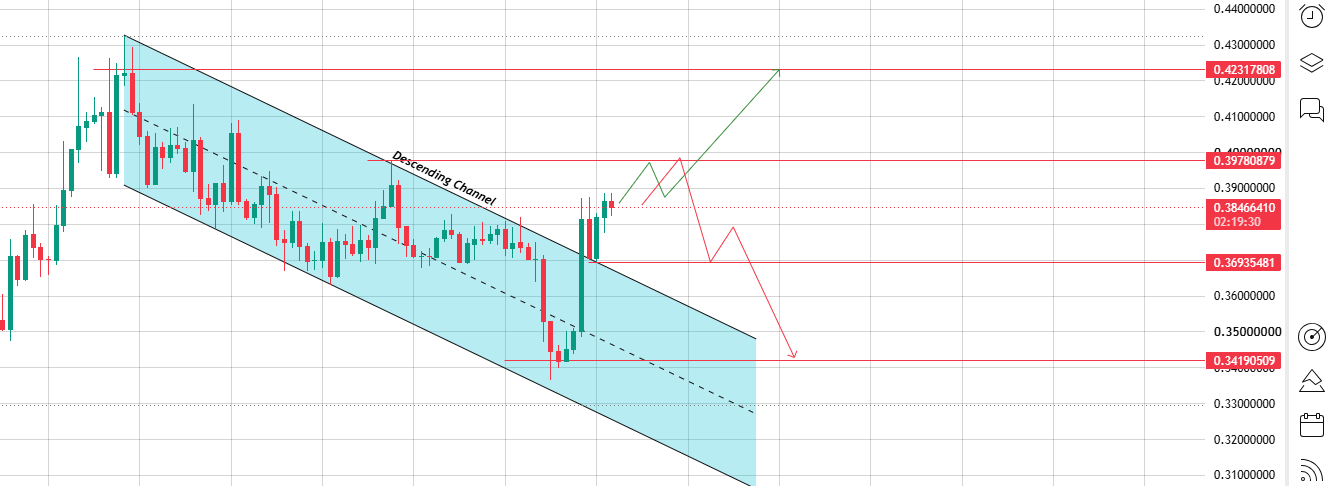
Source: Chart Taken From TradingView
Price pushed clean through the upper boundary and is now trading around $0.38466410, holding above the old resistance line instead of getting rejected by it.
That breakout puts $0.39780879 in play as the immediate target, with $0.42317808 next if momentum carries through notice how that lines up almost exactly with the daily triangle's upside targets, which is the kind of confluence technical traders actually pay attention to.
The old channel structure now flips into a support zone: a pullback toward $0.36935481 would still keep the breakout intact, but a deeper slide back to $0.34190509 would start raising real questions about whether this was a fakeout.
SPX6900 price prediction July 2026: Symmetrical Triangle Nears Decision Time
Pull up the daily chart, and it's about as clean a symmetrical triangle as you'll find: upper trendline sloping down from the $0.497 highs, lower trendline sloping up off the $0.25 region lows, both converging toward the same point in time. 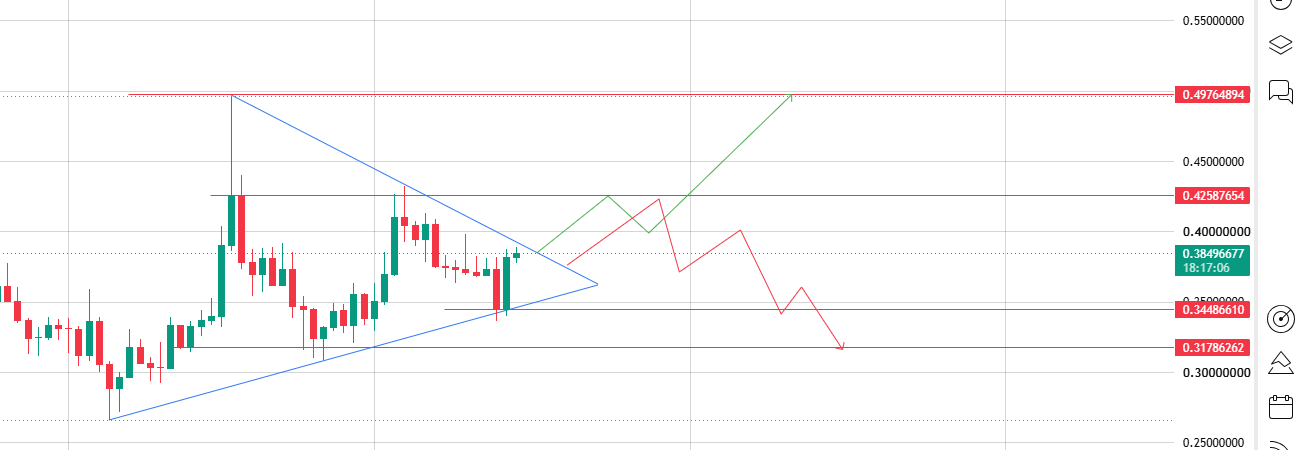
Source: Chart Taken From TradingView
Price is currently trading right inside that narrowing wedge near $0.3849, with barely any room left before the lines meet.
Break the upper boundary with volume behind it, and $0.42587654 becomes the first resistance level to clear, with a stretch target of $0.49764894.
If buyers really commit to that level, it marks the prior swing high, so reclaiming it would be a genuine statement.
Fail to hold this triangle and break the lower boundary instead, and $0.34486610 gets tested first, with $0.31786262 next in line if sellers take over.
Symmetrical triangle breaks like this one rarely fizzle out; they tend to launch hard in whichever direction wins the fight at the apex.
SPX6900 Three-Scenario Price Outlook: Bull, Bear, Neutral
The setups on both timeframes point toward a possible bullish breakout, but a clean scenario table keeps the bearish breakdown risk honest too:
| Scenario | Trigger | Price Target |
|---|---|---|
| Bullish Breakout | Daily triangle breaks upward through $0.42587654, confirming the 4H channel breakout. | $0.49764894 |
| Neutral / Range-bound | Price holds between $0.36935481 and $0.39780879 without a clean break either way. | $0.38466410–$0.39780879 |
| Bearish Breakdown | Daily triangle breaks downward through $0.34486610, invalidating the 4H breakout. | $0.31786262 |
Final Outlook: What Could Send SPX6900 Price Prediction july 2026 Toward New Highs
Put the pieces together, and SPX6900 is sitting in a genuinely rare spot.
The 4-hour descending channel has already broken to the upside; the daily symmetrical triangle is closing in on its own apex with targets that line up with the channel breakout.
Shorts just got flushed on the move, and social sentiment is leaning hard toward a continuation rather than a fade.
That's a lot of signals pointing the same way at once.
The macro backdrop will likely decide how far this actually runs.
SPX6900 price prediction July 2026, like most higher-beta meme names, tends to catch a disproportionate bid when BTC dominance eases and capital rotates back into altcoins; a stable-to-bullish Bitcoin tape would give this breakout real room to work.
There's an ETH correlation angle worth watching too, since broader altcoin risk appetite tends to track Ethereum's strength almost as closely as Bitcoin's.
If both hold steady while SPX6900 clears $0.39780879 and then $0.42587654, the path toward retesting $0.49764894 starts looking a lot less like a stretch and a lot more like the obvious next move.
Disclaimer: This article is for informational purposes only and should not be taken as financial advice. Always do your own research before making investment decisions.
Also read:

















