Bittensor Price Prediction August 2026: $TAO Targets and Risks, Next?


Bittensor is holding steady today with its chart coiling into a tight, symmetrical triangle right as the breakout point approaches.
This Bittensor Price Prediction August 2026 covers the triangle structure, EMA and resistance & support levels, liquidation data, and holder growth behind the current setup.
Bittensor is a decentralized machine learning network that rewards participants for contributing useful AI models, according to its own project materials.
Stay till the end for the full bull and bear case.
Bittensor Price Prediction Today: Market Overview and TAO Price
Metric | Value |
Price | $193.70 |
24h Change | +0.52% |
Market Cap | $2.16B (+0.55%) |
24h Volume | $130.9M (+7.33%) |
Vol/Mkt Cap (24h) | 6.06% |
FDV | $4.06B |
Total Supply | 21M TAO |
Max Supply | 21M $TAO |
Circulating Supply | 11.18M $TAO |
Holders | 1.84K |
Profile Score | 74% |
Source: Data from CoinMarketCap as of 31/07/2026. Figures may vary slightly across other tracking websites.
Bittensor Subnet Update: Babelbit and Vocence Partnership
Babelbit.ai, a project operating on $Bittensor Subnet 78 ($TAO SN78), announced a partnership with VoceneAI.
Source: Data From X
Per the announcement, Babelbit's real-time language API will be integrated into Vocence's voice agent platform, with both teams cross-promoting their products to each other's customer base.
This is subnet-level ecosystem news from the project's own announcement rather than a confirmed protocol-level development for TAO itself.
Bittensor Liquidation and Volume Data
TAO's futures liquidations, per Coinglass, are long-heavy in the shorter windows before balancing out: 1h totals $252.57, all long ($0 short); 4h totals $12.00K, also entirely long; 12h totals $21.80K, split $12.48K long versus $9.32K short; 24h totals $35.06K, nearly even at $17.48K long versus $17.58K short. 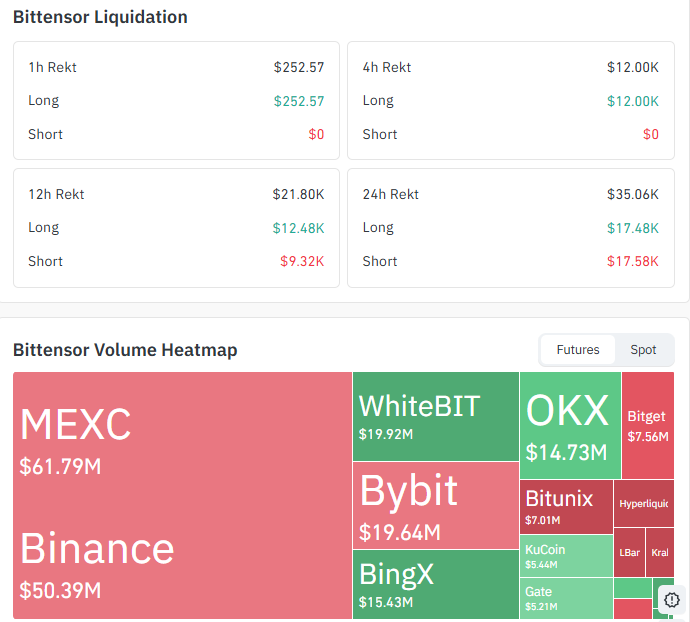
Source: Data From CoinGlass
That shift from long-only liquidations to a balanced 24-hour split suggests two-way pressure building as price consolidates.
On futures volume, MEXC leads at $61.79M, followed by Binance ($50.39M), WhiteBIT ($19.92M), Bybit ($19.64M), BingX ($15.43M), and OKX ($14.73M), with smaller volume across Bitget, Bitunix, KuCoin, Gate, Hyperliquid, LBank, and Kraken.
This is separate from the $130.9M spot volume in the overview above.
TAO forecast 2026: Bittensor Holder Growth
TAO's holder count has climbed steadily over the past 30 days, from around 1.5K on July 2 to 1.84K by July 30, even as market cap held near $2.16B through the same stretch. 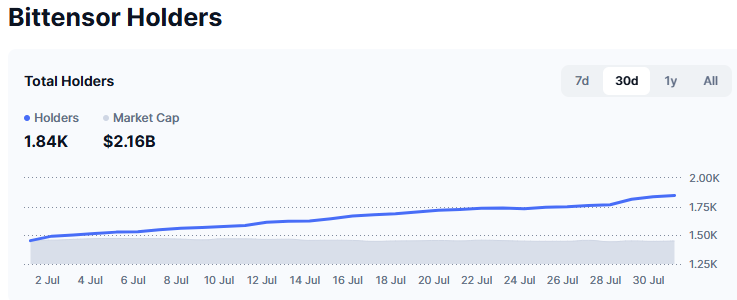
That kind of gradual, uninterrupted holder growth during a consolidation phase is typically read as quiet accumulation rather than a sign of distribution.
Bittensor Prediction Chart: Technical Analysis
Pair: $Bittensor/USD · Market: Spot (Crypto) · Timeframe: 1D · Source: TradingView · Timestamp: July 31, 2026, 16:16 UTC+5:30
TAO trades at $193.70. The chart shows a large symmetrical triangle taking shape since the March high near $360, with a series of lower highs pressing down against a flat horizontal support running along the bottom.
After breaking down from the triangle, the price is now consolidating right near the triangle's apex, which typically signals that a breakout in either direction is close.
If the price breaks below the $180 level, it could confirm a proper selling structure and continue lower until that level is reclaimed.
If it holds above $180, it could move toward $239, and the earlier breakdown could turn out to be a fake breakdown."
Current price sits below both key EMAs, with the EMA 20 at $197.03 and the EMA 50 at $209.97 listed separately from the horizontal resistance and support levels below, since both EMAs sit just above the current price as their own near-term resistance. 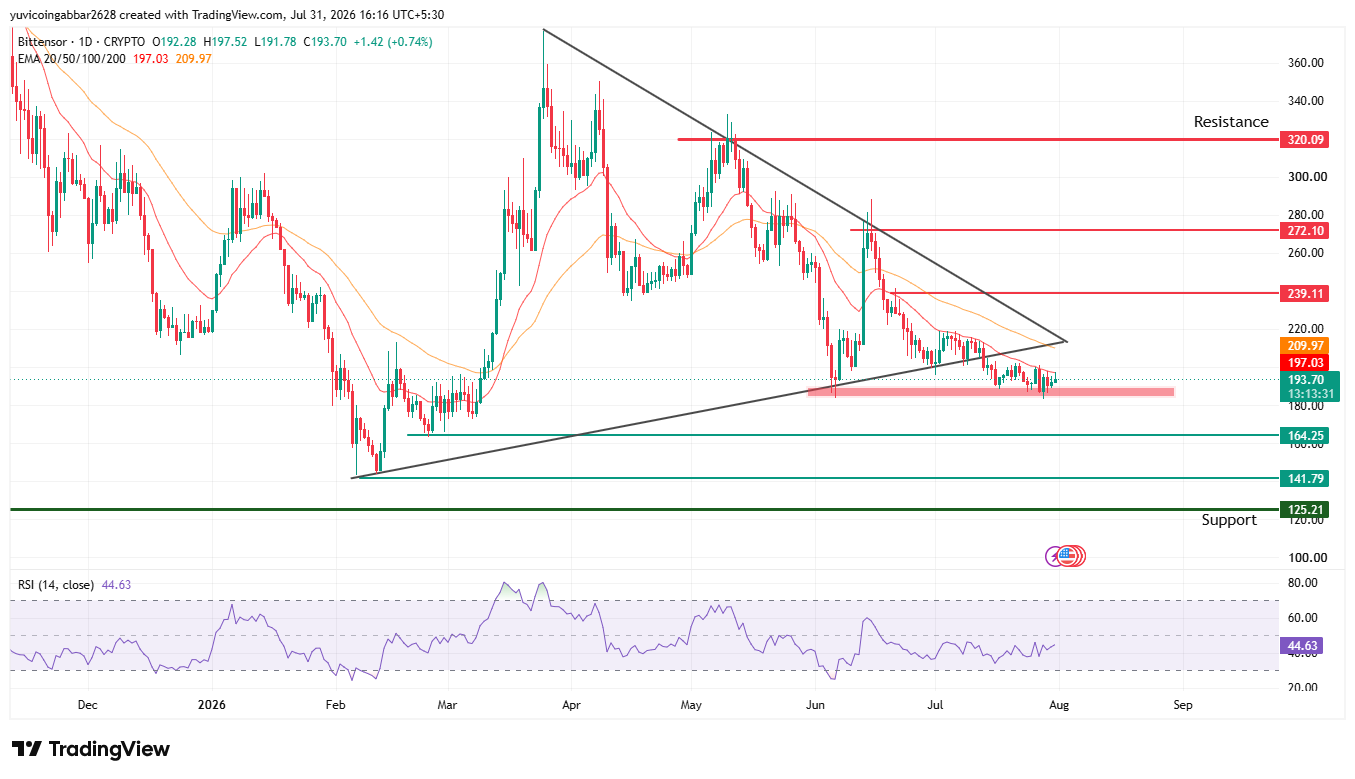
The structure stays neutral-to-bearish until price breaks above $239.11 and reclaims both EMAs. RSI(14) reads 44.63, sitting just under the neutral midline.
Level Type | Price |
Resistance | $320.09 |
Resistance | $272.10 |
Resistance | $239.11 |
EMA 20 (near-term resistance) | $197.03 |
EMA 50 (near-term resistance) | $209.97 |
Immediate Price Reference | $193.70 |
Support (triangle base) | $164.25 |
Support | $141.79 |
Support | $125.21 |
Bittensor Forecast August 2026: Bull Case vs. Bear Case
Bull case: If TAO moves upside and reclaims the EMA 20 ($197.03) and EMA 50 ($209.97), that opens the door to a retest of $239.11.
A clean break above that would put $272.10 and eventually $320.09 in view. Steady holder growth through the consolidation adds some support to this case.
Bear case: A breakdown below the triangle's flat support and the $164.25 level would signal the pattern has resolved to the downside, opening room toward $141.79, with $125.21 as the deeper level if selling pressure continues.
The near-even 24h liquidation split shows two-way risk is already building at these levels.
Can TAO Reach the Bittensor Price Target of $272.10?
A move to $272.10 would require TAO to first clear both EMAs and the triangle breakout level at $239.11, then hold above that zone on a sustained basis.
That would mark a meaningful reversal of the downtrend that's been in place since the March high, so it's a bigger ask than simply breaking out of the triangle.
What Could Invalidate the Bittensor Bullish Forecast?
A confirmed daily close below the triangle's support near $164.25 would undercut the near-term recovery case and point toward $141.79, with $125.21 as the deeper level if the breakdown extends.
A rejection at either EMA before that would also weaken the bull case.
Bittensor Short-Term Forecast: A Liquidation-Based Read
The move from long-only liquidations in the 1h and 4h windows to a nearly balanced 12h and 24h split, per Coinglass, suggests the market is losing conviction in either direction as price nears the triangle apex.
That kind of two-way liquidation pressure right at a converging pattern often precedes a sharp move once the breakout direction is confirmed.
Bittensor Price Prediction Methodology
This forecast draws on multiple inputs rather than a single chart pattern: the symmetrical triangle structure, EMA positioning relative to price, horizontal resistance and support levels, RSI momentum, recent liquidation activity, and holder trends. No single data point is treated as decisive on its own.
Bittensor Price Prediction August 2026: Expert View
According to CoinGabbar analysts, Bittensor's chart shows a classic symmetrical triangle nearing its apex, with the EMA 20 and EMA 50 sitting just overhead as near-term resistance separate from the larger horizontal levels built up since March.
RSI just under 50 and a near-even split in 24h liquidations both point to a market genuinely undecided at this level, even as holder counts keep climbing through the consolidation.
The near-term question is which way the triangle resolves once it reaches its apex.
Bittensor Price Prediction August 2026: Data Sources
Price, market cap, and supply data referenced from a CoinMarketCap-style tracker, snapshot taken July 31, 2026. Liquidation and futures volume data referenced from Coinglass, as of July 31, 2026. Holder trend data covers the 30 days through July 30, 2026. Chart analysis (EMA, RSI, resistance, support) sourced from a 1D $Bittensor/USD chart on TradingView, timestamped July 31, 2026, 16:16 UTC+5:30.
Disclaimer: This piece is for informational purposes only and isn't financial advice. Crypto prices are volatile, and it's worth doing independent research before acting on any of the levels discussed here.











.jpg)






