Shiba Inu Price Prediction: Does a 149% Burn Spike Signal a Bounce?

Shiba Inu has been sliding lower for weeks, but a sudden jump in token burns is giving holders something new to watch.
The question is whether this Shiba Inu price prediction burst of burn activity can actually shift price direction, or whether it is simply noise on top of a weak chart.
Shiba Inu Coin launched in 2020 as a meme token inspired by the Shiba Inu dog breed and has since built out an ecosystem that includes its own decentralized exchange and a Layer 2 network called Shibarium.
Its enormous, slowly shrinking supply remains central to how the community frames its long-term outlook.
The Shiba Inu price today is $0.00000489, down 5.2% over the past 24 hours.
The 24-hour range runs between $0.00000488 and $0.00000520, with a market capitalization of $2.884 billion.
Live Market Data
Metric | Value |
Price | $0.00000489 |
24h Change | -5.2% |
Market Cap | $2.884B |
Fully Diluted Valuation | $2.885B |
24h Trading Volume | $86.21M |
Circulating Supply | 589.239T |
Total Supply | 589.496T |
Source: $SHIB market data taken from CoinGecko, as of Sep 16, 2026. Figures may vary slightly across other tracking websites.
Exchange Volume
Trading activity remains spread across several mid-tier exchanges rather than concentrated on one venue. 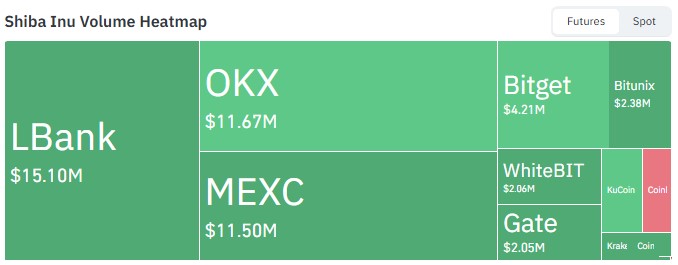
Source: Volume Heatmap Data Taken From CoinGlass, As of Sept 16, 2026.
LBank leads with $15.10 million in 24-hour volume, followed by OKX at $11.67 million and MEXC at $11.50 million.
Bitget, Bitunix, WhiteBIT, and Gate each contributed smaller but meaningful volume to the overall total.
Shiba Inu Coin News Today
Shibburn reported a sharp jump in burn activity, with 3,000,000 SHIB tokens burned in a single hour across one transaction.
Over the past 24 hours, total burns reached 3,353,771 SHIB, a 149.59% increase compared to the prior day. 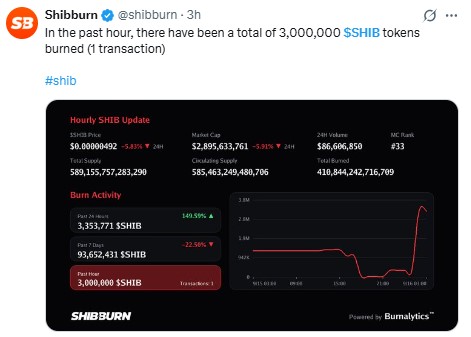
Source: Data Taken From @shibburn, X Account, as of Sep 16, 2026
However, the outlet's own data shows a different picture over a longer window, with 7-day burn totals down 22.56% at $93,652,431 SHIB.
This contrast between a sharp short-term spike and a weaker weekly trend is worth watching as part of the broader Shiba Inu News cycle, since a single large burn transaction does not necessarily represent a sustained shift in burn rate.
Shiba Inu Coin Technical Analysis
The 4-hour SHIB/USDT chart on Binance shows price trading inside a descending channel that has held since early September, with the current candle sitting near the channel's lower boundary. 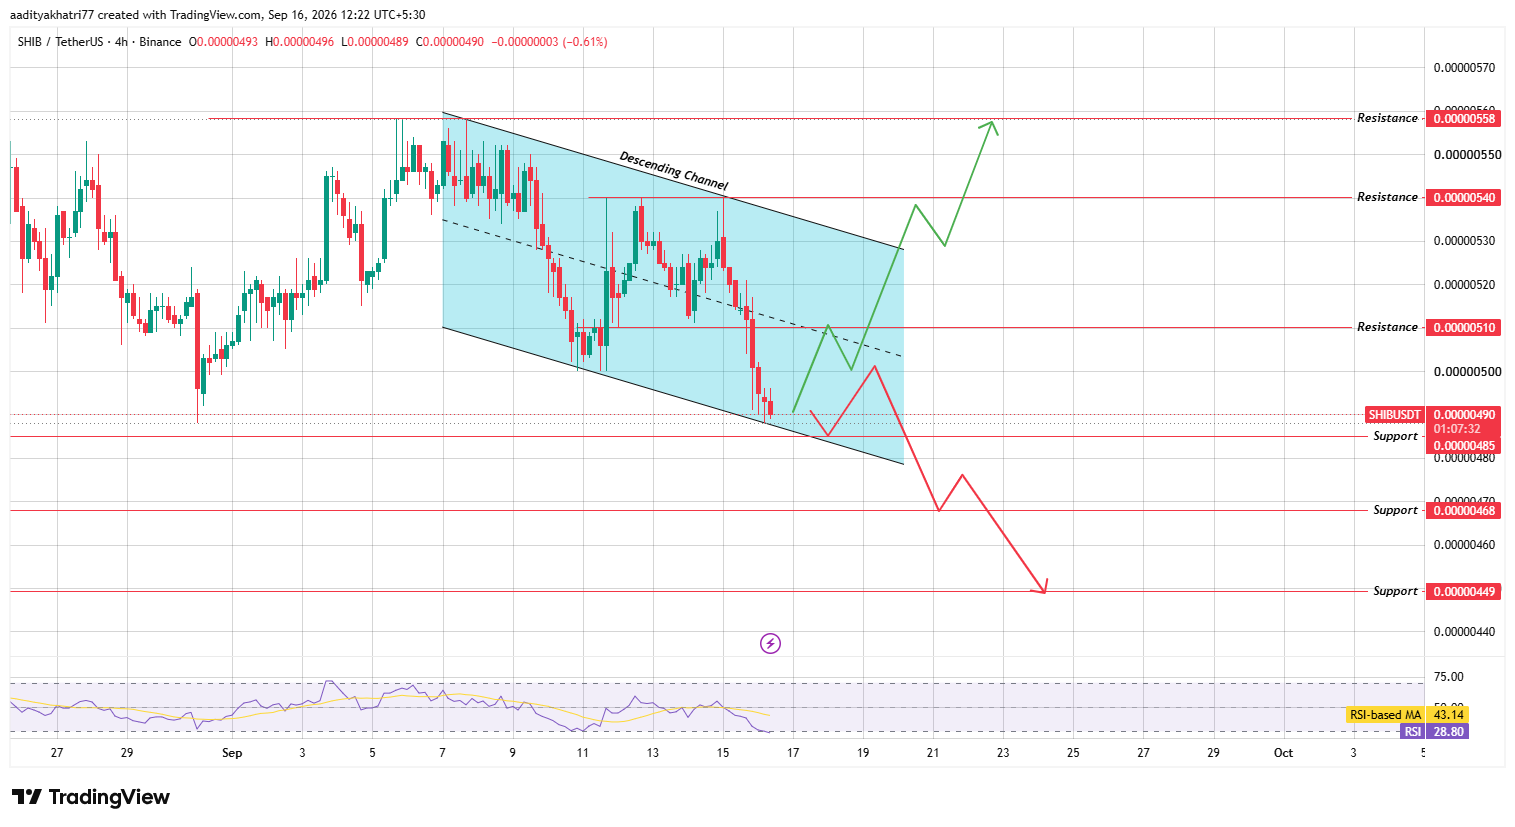
Source: Chart taken from TradingView, as of Sep 16, 2026
RSI reads 28.80, deep below its moving average of 43.14, putting momentum firmly in oversold territory.
Can $SHIB Bounce and Break the Channel Resistance?
A confirmed 4-hour close back above $0.00000510, supported by rising volume, would signal the first sign of a genuine bounce.
Clearing that level could open a path toward the channel's upper boundary near $0.00000540, and a sustained move beyond that zone would put $0.00000558 in view.
What Happens If $SHIB Gets Rejected at Support?
If the current bounce attempt fails and the price turns back down, a break below $0.00000485 would confirm continued weakness.
That scenario could send the price toward $0.00000468, with a deeper breakdown opening the door to $0.00000449.
Support and Resistance Levels
Support | Resistance |
$0.00000485 | $0.00000510 |
$0.00000468 | $0.00000540 |
$0.00000449 | $0.00000558 |
Bull, Base, and Bear Scenarios
Scenario | Setup | Level |
Bull | Bounce off channel low, break upper resistance with volume | $0.00000510–$0.00000558 |
Base | Continued range inside the descending channel | $0.00000485–$0.00000510 |
Bear | Rejection at support, breakdown below channel low | $0.00000468–$0.00000449 |
Shiba Inu Coin Vs Bitcoin
SHIB's pullback has occurred alongside broader weakness across the crypto market, with Bitcoin Price Today also trading lower from its recent range.
As a large-cap meme token, $SHIB tends to track Bitcoin's overall direction during risk-off periods, even as burn-related news occasionally drives short bursts of independent price action.
A stabilizing Bitcoin market would likely improve conditions for a $SHIB bounce attempt, while continued Bitcoin weakness could reinforce pressure on the channel's lower boundary.
Methodology
This Shiba Inu price prediction is based on 4-hour chart analysis of the SHIB/USDT pair sourced from Binance via TradingView, covering channel structure, RSI momentum, and defined support and resistance zones.
Burn and volume data reflect figures at the time of writing and can shift quickly. This analysis does not constitute financial advice.
Expert Opinion
Analysts tracking meme coin tokenomics generally caution against reading too much into single-hour burn spikes, since one large transaction can distort short-term figures.
A more reliable signal, in their view, would be a sustained rise in daily burn totals over several consecutive sessions rather than an isolated hourly jump.
Disclaimer: This article is for informational purposes only and does not constitute financial advice. Cryptocurrency markets are highly volatile, and prices can move sharply in either direction. Support and resistance levels discussed here are technical estimates, not guarantees, and actual price movement may differ significantly. Readers should conduct their own research before making investment decisions.













.jpg)




