Shiba Inu Price Prediction: Will $0.0000054 Hold This Week?

Shiba Inu is facing a familiar test this week, and this time it arrives alongside a sharp slowdown in one of the metrics its community watches most closely.
Whether buyers step in at current levels will shape near-term Shiba Inu price prediction September 2026 discussions.
Shiba Inu launched in 2020 as a self-described Dogecoin alternative built on Ethereum, and it grew into one of the largest meme-based tokens by community size and total supply.
Its ecosystem later expanded to include a decentralized exchange and its own Layer 2 network, but the shiba inu coin itself remains the primary asset most traders and holders follow.
The Shiba Inu price today is $0.00000515, down 2.0% over the past 24 hours, having traded within a range of $0.000005152 to $0.000005387 during that window.
The current Shiba Inu price levels put its market capitalization near $3.037 billion, keeping it among the more actively discussed large-supply tokens in Shiba Inu coin news.
Live Market Data
Metric | Value |
Price | $0.00000515 |
24h Change | -2.0% |
24h Range | $0.000005152 - $0.000005387 |
Market Cap | $3.037B |
Fully Diluted Valuation | $3.039B |
24h Trading Volume | $68.571M |
Circulating Supply | 589.239T |
Total Supply | 589.496T |
Exchange Volume
Trading activity in Shiba Inu is spread across a wider set of smaller venues than most large-cap tokens. LBank leads with $11.36 million in 24-hour volume, followed closely by OKX at $10.10 million. 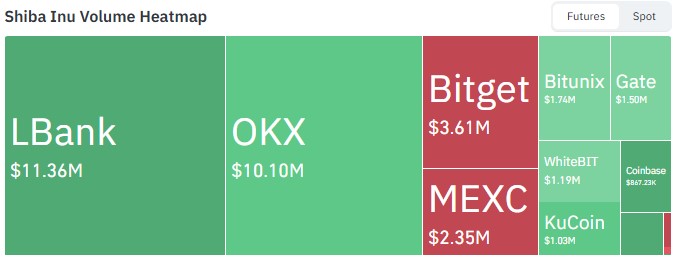
Source: Volume Heatmap Data Taken From CoinGlass, As of Sept 15, 2026.
Bitget contributes $3.61 million, while MEXC adds $2.35 million. Smaller volume comes from Bitunix at $1.74 million, Gate at $1.50 million, WhiteBIT at $1.19 million, KuCoin at $1.03 million, and Coinbase at $867.23 thousand.
The lack of a single dominant exchange suggests SHIB's trading activity is more fragmented than average, which can add to short-term volatility around key shiba inu price levels.
Shiba Inu News
A notable shift in on-chain activity has caught attention this week. Data from Shibburn shows that $SHIB tokens burned in the past 24 hours dropped by nearly 93%, even as the weekly burn total rose 76.73%, with close to 150 million SHIB burned over that longer period. 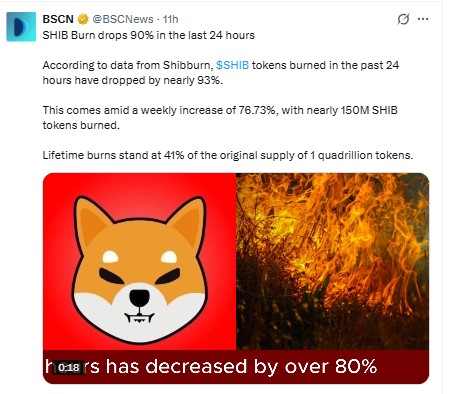
Source: Data Taken From @BSCNews, X Account, as of Sep 15, 2026
Lifetime burns now stand at roughly 41% of the original one-quadrillion-token supply.
A sharp daily drop like this, sitting alongside a strong weekly figure, points to uneven burn activity rather than a clear trend, and it adds a layer of uncertainty to near-term shiba inu technical analysis heading into the trendline test.
Shiba Inu Price Prediction: Technical Analysis
The daily SHIB/USDT chart on Binance shows the price holding above a rising trendline that has supported the token since late August. 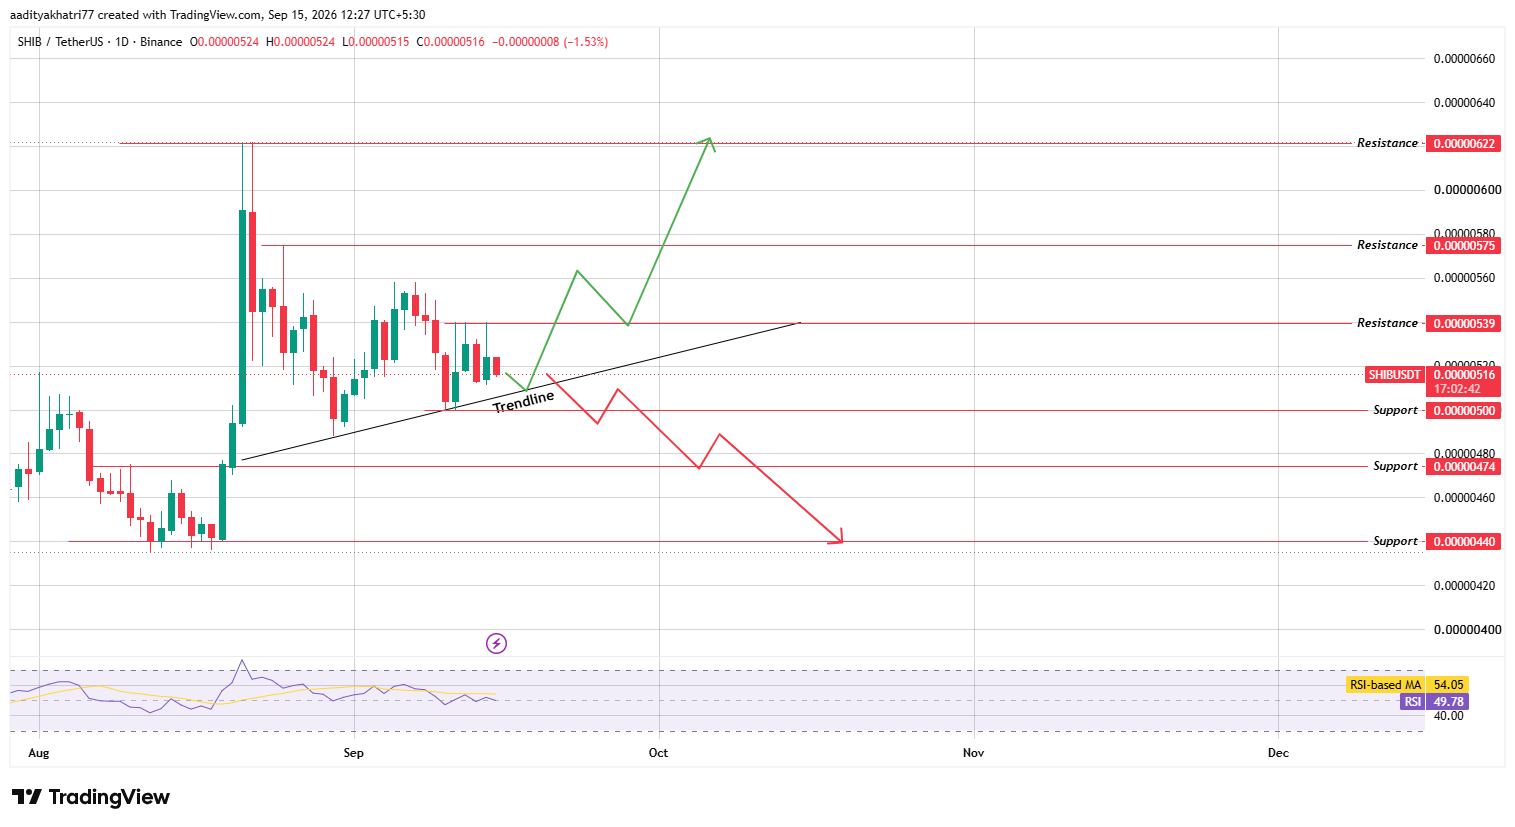
Source: Chart taken from TradingView, as of Sep 15, 2026
The most recent daily candle closed at $0.00000516, down 1.53% on the session, with the Relative Strength Index at 49.78, just below its 54.05 moving average.
That reading points to momentum that has softened slightly but remains close to neutral.
This trendline sits at the center of the current shiba inu price prediction, since a bounce or a breakdown from here would likely set the tone for the coin's next move.
Can $SHIB Bounce and Break Toward Higher Resistance?
A bounce off the rising trendline, confirmed by a daily close back above $0.00000539 on rising volume, would open the path toward $0.00000575.
Clearing that level with continued strength could extend the move toward $0.00000622, and a sustained break beyond that resistance would mark a meaningful shift in the broader shiba inu coin price prediction picture.
What Happens If the Trendline Breaks
If the price instead breaks below the rising trendline on a confirmed daily close, the setup would flip toward the downside.
That scenario points first to $0.00000500, with a deeper pullback potentially testing $0.00000474 and then $0.00000440 if selling pressure builds through the rest of September.
Support and Resistance Levels
Support | Resistance |
$0.00000500 | $0.00000539 |
$0.00000474 | $0.00000575 |
$0.00000440 | $0.00000622 |
Scenario | Setup | Level |
Bull | Trendline bounce with resistance break | $0.00000539 - $0.00000622 |
Base | Consolidation near the trendline | $0.00000500 - $0.00000539 |
Bear | Confirmed break of the rising trendline | $0.00000474 - $0.00000440 |
Shiba Inu's value in BTC terms rose roughly 1.4% over the past 24 hours, even as its dollar price declined, pointing to some relative strength against Bitcoin during this pullback.
This kind of divergence is not unusual for SHIB, which can move somewhat independently of Bitcoin's short-term swings when token-specific news, such as the recent burn data, is driving attention.
A firmer bitcoin price today would generally make it easier for SHIB to clear its resistance levels, while renewed bitcoin weakness could add pressure to the rising trendline already being tested.
Methodology
This Shiba Inu price prediction is based on the daily SHIB/USDT chart on Binance, cross-checked against live market data and exchange-level trading volume pulled at the time of writing.
Support and resistance levels were taken directly from the chart's marked trendline and horizontal structures rather than estimated.
Liquidation data was not available for this update and has been left out rather than estimated.
None of the scenarios described above should be read as guaranteed outcomes for the Shiba Inu coin given how quickly sentiment can shift.
Expert Opinion
Commentary around Shiba Inu this week has focused heavily on the sharp swing in burn activity, with some observers noting that a single day's near-93% drop is less meaningful than the stronger 76.73% weekly figure it followed.
Others pointed out that burn rate swings of this size have historically had limited direct impact on price without accompanying volume or broader market strength.
The general view remains that the rising trendline test on the daily chart will likely carry more weight for near-term direction than the burn data alone.
Disclaimer: This article is for informational purposes only and should not be considered financial advice. Cryptocurrency markets, including Shiba Inu, are highly volatile, and the scenarios outlined above carry meaningful downside risk. Prices can move against any of the levels discussed here, and readers should conduct their own research and consult a qualified financial advisor before making investment decisions.












.jpg)





