Silver Price Prediction: NFP Volatility, What's Next for XAG/USD?


Silver price prediction takes on extra weight today as a major US data release lands this evening and XAG/USD faces a decision point.
Will the number spark a breakout or a fakeout? Here is the news, the data, and the levels that matter before the release.
Editorial disclosure: the CoinGabbar desk holds no personal position in silver.
Silver Price Today: Live XAG/USD Price and Current Market Data
Silver (XAG/USD) trades at $61.159 on the 1-hour FOREX.com chart, with a bid of $61.140 and an ask of 61.180.Thecurrent 1-hourcandle is down 0.23% (-0.139).
Source: TradingView, FOREX.com, Oct 2, 2026, 14:25 IST.
Silver News Today: US Jobs Data at 6 PM IST and What It Means
Today's economic calendar is the main catalyst. At 6:00 PM IST, the US releases the Non-Farm Employment Change (forecast 89K, previous 162K), the Unemployment Rate (forecast 4.1%, previous 4.1%), and Average Hourly Earnings m/m (forecast 0.3%, previous 0.3%). 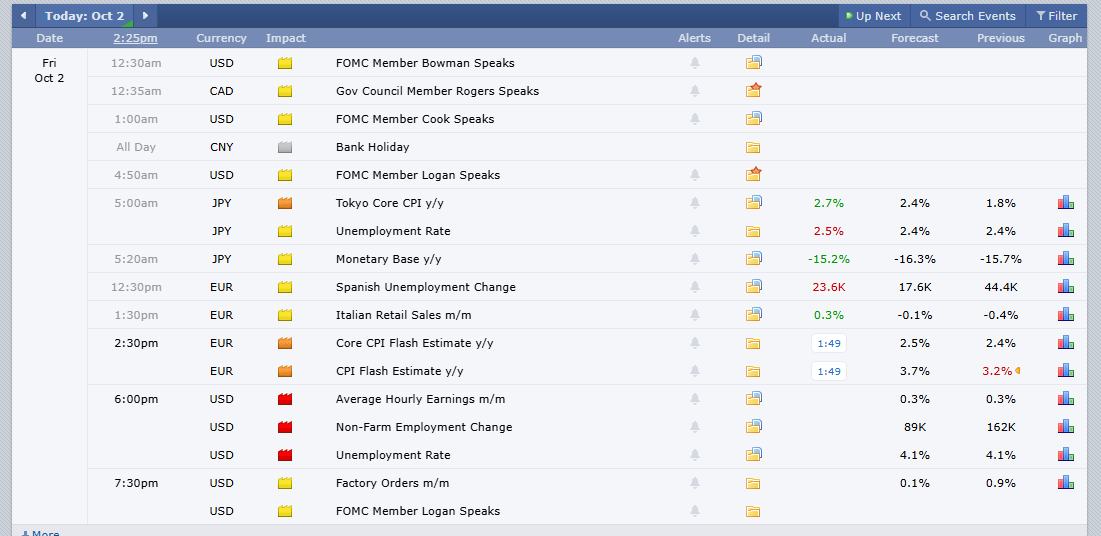
The calendar marks all three as high impact. At 6:00 PM IST, Factory Orders m/m (forecast 0.1%, previous 0.9%) follows, along with remarks from FOMC member Logan.
Why it matters: these are scheduled releases with consensus forecasts, not confirmed results. XAG pays no yield, so it often reacts to shifts in the US dollar and rate expectations.
The jobs forecast of 89K sits well below the previous 162K, so a surprise in either direction can move those expectations quickly.
Silver Key Takeaways: XAG/USD Setup, Support, and Price Targets
XAGUSD trades at $61.159 (1H, FOREX.com chart, Oct 2, 2026, 14:25 IST) and has tested descending trendline resistance about seven times.
Bullish trigger: 1-hour close above $62.321 (+1.90%). Targets: $67.543 (+10.44%) and $71.193 (+16.41%).
Bearish trigger: 1-hour close below $57.543 (-5.91%). Next support: $54.803 (-10.39%).
US jobs data lands at 6:00 PM IST, so volatility can spike around both triggers.
Every figure for the release is a forecast, not a confirmed result.
Caution: At exactly 6:00 PM IST, when the US data releases, a single candle can be extremely aggressive in either direction, and a one-minute spike can trigger both resistance and support, so treat only a 1-hour close as confirmation.
Silver Technical Analysis: XAG/USD Descending Trendline Setup
Structure and trend. Silver fell from the $67.543 swing high on Sep 23 to the $60 area and has since moved sideways just below a descending trendline. The broader move is down, but the decline has slowed into a tight range.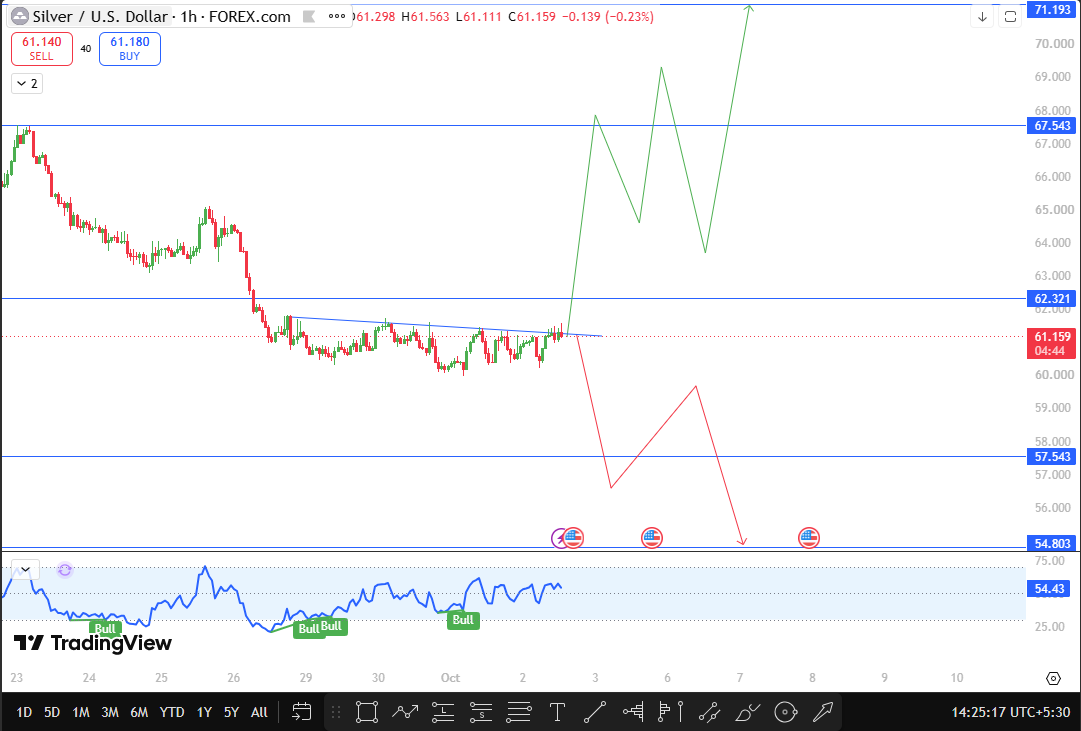
Pattern. The trendline has been tested about seven times, and the price is sustaining at it instead of retreating. Repeated tests can wear resistance down, but the line only breaks on a close through it, and $62.321 is the confirmation level above it.
Breakout. A 1-hour close above $62.321 confirms the break above the trendline and opens $67.543, 10.44% higher, where the Sep 23 rally peaked. $71.193 is the major resistance on this setup, 16.41% away, and would need a sustained trend change, not one session.
Breakdown. $57.543 is the invalidation level, 5.91% below. It sits under the recent $60 lows, so a close beneath it would confirm the downtrend is continuing and expose $54.803, 10.39% lower.
Momentum. The oscillator reads 54.43, slightly above the midpoint, so momentum is neutral to mildly positive. Bull labels formed near the late-September lows and the Oct 1 low, where selling lost strength. The chart shows no Bear label.
Confirmation. Both triggers need 1-hour closes, not wicks.
Silver Support and Resistance Levels: XAG/USD Price Target Zones
Level | Type | Importance | Distance From Current Price |
$71.193 | Major resistance | Final upside target | +16.41% |
$67.543 | Resistance | Sep 23 swing high | +10.44% |
$62.321 | Breakout trigger | Confirms trendline break | +1.90% |
$61.159 | Current price | Trendline test | 0% |
$57.543 | Support, invalidation | Loss confirms downtrend. | -5.91% |
$54.803 | Support | Next downside target | -10.39% |
Silver Price Prediction Scenarios: Bullish, Base, and Bearish XAG/USD
Bullish. Confirmation is a 1-hour close above $62.321. Targets are $67.543, then $71.193. The scenario fails if the price closes back below $62.321 after confirming. A successful retest of $62.321 strengthens it. A data spike that reverses within the hour weakens it.
Base. Price stays between $57.543 and $62.321, a range of -5.91% to +1.90%, with the trendline continuing to cap rallies. Confirmation is the absence of a 1-hour close beyond either level, and there are no directional targets. A close outside the range ends it. Further rejections at the trendline strengthen it.
Bearish. Confirmation is a 1-hour close below $57.543. The target is $54.803. The scenario fails if the price closes back above $57.543. A failed retest from below strengthens it, and a quick reclaim weakens it.
XAG Market Context: US Jobs Data, Fed Speakers and Volatility
The calendar stacks three events inside 90 minutes: jobs data at 6:00 PM IST, then factory orders and Logan's remarks at 7:30 PM IST.
That keeps volatility elevated into the evening, and the 1-hour candle that closes after each event matters more than the spike that precedes it.
XAG Price Risks: Fake Breakouts, Data Volatility, and Whipsaws
A 1-hour breakout can reverse within hours. Data-driven whipsaws can touch both levels in the same hour. The trendline has rejected the price about seven times, so a failed breakout is a real possibility. A close below $57.543 invalidates the setup.
Conclusion: XAG/USD Triggers to Watch Next
This price prediction depends on two closes. Above $62.321, the targets are $67.543 and $71.193. Below $57.543, support is $54.803. The 6:00 PM IST US jobs data is the main risk, and neither outcome is certain.
Disclaimer
This article is informational only and is not financial advice. Trading is volatile, and you can lose your entire capital. Do your own research.







.webp)








