Pi Network Price Prediction: Can PI Clear $0.09298 After OUSD News?


The Pi Network price prediction October 2026 starts with a stablecoin headline and a flat price.
PI has barely moved over the last day, even though its team just announced a new partnership.
Pi Network launched in 2019 as a mobile-first project where users, called Pioneers, mine the coin from their phones. Its Open Mainnet went live in February 2025.
For the latest Pi Network price today, the Pi coin trades at $0.09039, flat over 24 hours. PI ranks #80 with a market cap of $1.016B, and its 24-hour range runs from $0.08906 to $0.09076.
Live Pi Network Market Data
Metric | Value |
Price | $0.09039 |
24h Change | 0.0% |
24h Range | $0.08906 - $0.09076 |
Market Cap | $1.016B |
Source: market data taken from CoinGecko, as of Oct 2, 2026. Figures may vary slightly across other tracking websites.
Pi Network News Today Analysis
The latest Pi Network news centers on a partnership with Open Standard, the company behind the OUSD stablecoin.
The Pi Core Team announced the deal on September 30, the same day OUSD went live.
A post from Pi Network Alerts explains why traders care. It describes a model where reserve yield can be shared with ecosystem partners, based on how much OUSD is used. 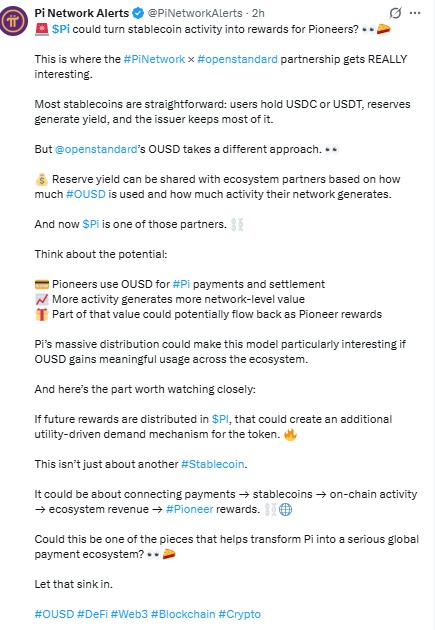
Source: Data Taken From @PiNetworkAlert on X, October 2, 2026
Pioneers could then use OUSD for payments, and part of the value could flow back as rewards.
The post adds that rewards paid in PI could create extra demand for the token. That part is a community view, not a confirmed plan.
The official message is narrower. Pi said it will explore rewards programs for Pioneers and wider utility across its ecosystem.
FXStreet reports that the details are not finalized. Open Standard says its network includes more than 200 partners, such as Visa, Google, and Stripe, but those firms are not direct Pi partners.
The news gives PI a clear story, and the price has not reacted yet. Traders should wait for reward details before treating it as a driver.
Pi Network Technical Analysis
This Pi Network technical analysis uses the 4-hour PIUSDT chart on OKX, captured at 13:45 IST on October 2, 2026. The active candle closes at 17:30 IST.
PI fell from around $0.0985 on September 15 to near $0.0805 by September 18. Since that low, price has formed a series of higher lows along a rising trendline.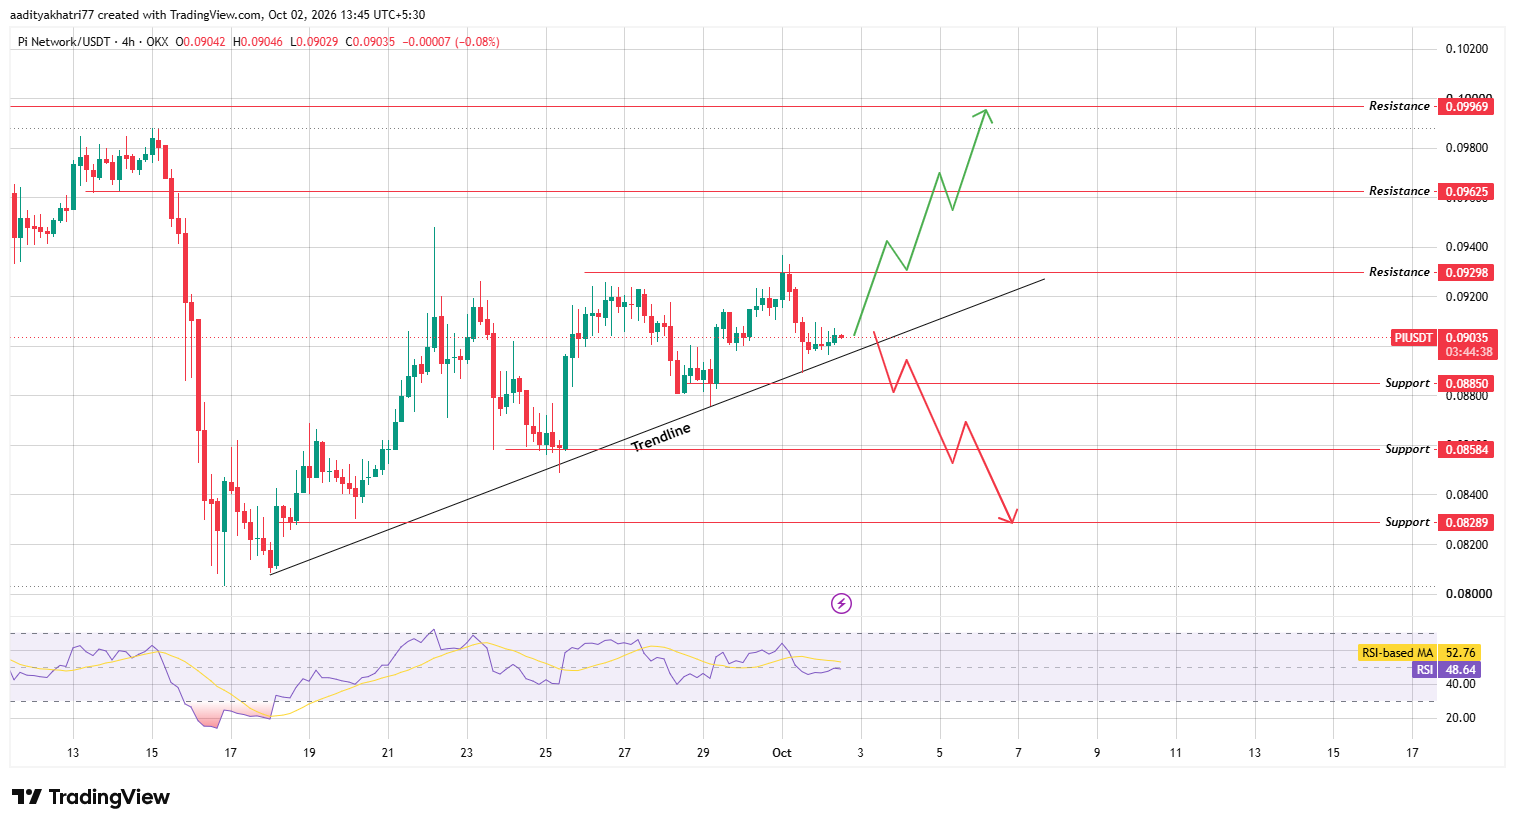
Source: Chart taken from TradingView, October 2, 2026
Price now sits just above that trendline, which runs near $0.0897. A dip toward it on October 1 drew buyers.
Resistance at $0.09298 has capped each rally since late September, and a brief push above it that day did not hold.
The RSI reads 48.64 and sits below its moving average of 52.76. Momentum is neutral with a soft lean, so buyers still need a clear trigger.
Can $PI Break Resistance?
The bullish case starts with a bounce from the rising trendline. The price is already close to it, so the test could come within the next few candles.
After the bounce, PI must close a 4-hour candle above $0.09298, about 2.9% above the current price. Volume should also rise above the average of the previous 20 candles. A close on thin volume would leave the move open to a fade.
If resistance gives way, the next level is $0.09625, roughly 6.5% higher. The final resistance is $0.09969, about 10.3% above today's price. That level sits close to the September high before the sharp drop.
The OUSD news could support this path over time. If the rewards plan brings real user activity, $PI would gain a reason to hold beyond sentiment.
What Happens If $PI Breaks the Trendline?
The bearish case begins with the trendline. A 4-hour close below it, near $0.0897, would end the series of higher lows that has held since September 18.
The first support is $0.08850, about 2.1% below the current price. A close under it would show sellers in control. The next support is $0.08584, roughly 5.0% lower.
The last level on the chart is $0.08289, a drop of about 8.3%. That area is close to the base of the mid-September sell-off, so it would test whether buyers return there.
Price Levels to Watch
Support | Resistance |
$0.08850 | $0.09298 |
$0.08584 | $0.09625 |
$0.08289 | $0.09969 |
Bull, Base, and Bear Scenarios
Scenario | Setup | Level |
Bull | Bounce from trendline, 4H close above resistance with rising volume | $0.09298, then $0.09625 and $0.09969 |
Base | Price holds above the trendline and moves sideways below resistance. | $0.0897 - $0.09298 |
Bear | 4H close below the trendline, then below support | $0.08850, then $0.08584 and $0.08289 |
Pi Network vs Bitcoin
Pi Network is a smaller asset, and it often moves with more swing than Bitcoin. A calm Bitcoin gives $PI room to test resistance. A sharp drop in BTC can pull it toward support.
Over the last 24 hours, PI was flat in dollars but fell 3.3% against Bitcoin. That means Bitcoin gained while $PI stood still.
PI will likely need a steady Bitcoin to hold the trendline. A weak market would add weight to the bearish case above.
Methodology
This Pi Network coin price prediction draws on three inputs. Levels, the trendline, and the RSI come from the OKX PIUSDT 4-hour chart on TradingView.
Market data comes from CoinGecko, and the news item comes from Pi Network Alerts, the Pi Core Team, and FXStreet.
Each signal depends on a closed 4-hour candle, because an open candle can reverse before it ends. All percentage moves are measured from $0.09039. We left out unverified claims and rumors.
Expert Opinion
Market commentary on the OUSD deal points to one open question. AMBCrypto notes that the impact depends on whether the planned rewards produce measurable user activity.
Chart watchers apply similar patience to rising trendlines. A hold shows the structure is intact, but a close below it changes the picture quickly.
For this Pi Network price forecast, the trendline, and the $0.09298 close are the two signals to follow.
Disclaimer: This article is for information only and is not financial advice. Crypto prices are volatile. PI can fall below every support level named here, including a drop of more than 8% in the bear case. No scenario is guaranteed, and readers should research independently and invest only what they can afford to lose.







.webp)








