US Crude Oil Price Prediction: Refinery Fire Fuels Shortage Fears


Oil traders got a jolt overnight. A supply disruption thousands of miles away is now colliding with a chart pattern that was already showing signs of strain.
WTI crude, the benchmark for US crude oil, dropped sharply into this session.
The move follows a report of drone strikes on a major Russian refinery, an event that could tighten global fuel supply just as prices were cooling off.
The US oil price today is $92.86 per barrel, down $1.91, or 2.02%, on the session.
This US crude oil price prediction examines whether renewed supply concerns can offset recent selling pressure or whether the broader pullback continues regardless of the geopolitical headline.
US Oil Live Market Data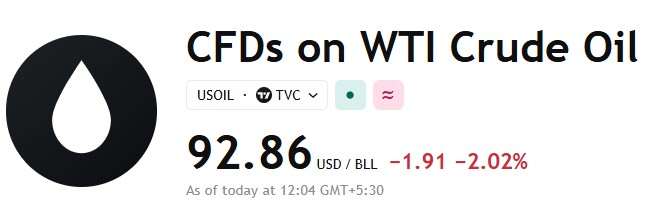
Source: FXCM WTI Crude Oil CFD data, hourly chart, as of September 25, 2026, 12:04 UTC+5:30.
US Crude Oil News Today
A widely followed geopolitical and markets account reported that Ukrainian drones struck Russia's Perm oil refinery, sparking a fire at one of the country's largest fuel-producing plants.
Perm reportedly produces around 5.3 million tonnes of diesel a year and sits among Russia's six biggest diesel refineries, which together account for close to half of the country's total diesel output. 
Source: Data Taken From @BullTheoryio, X Account, as of Sep 25, 2026
This attack followed a separate strike just last week that damaged Moscow's largest refinery and forced a halt to its crude processing operations.
What makes this development notable is the timing. These strikes reportedly happened only days after President Trump said Russia and Ukraine had agreed to stop targeting each other's energy infrastructure.
If that understanding has already broken down, traders may start pricing in a higher risk of further refinery outages.
Reduced refining capacity in a major producer nation typically points toward tighter fuel supply, and tighter supply has historically pushed crude prices upward even when broader demand trends stay flat.
That dynamic sits in direct tension with the bearish technical setup on the hourly chart, and it is one reason this US crude oil price outlook carries more uncertainty than usual right now.
Technical Analysis
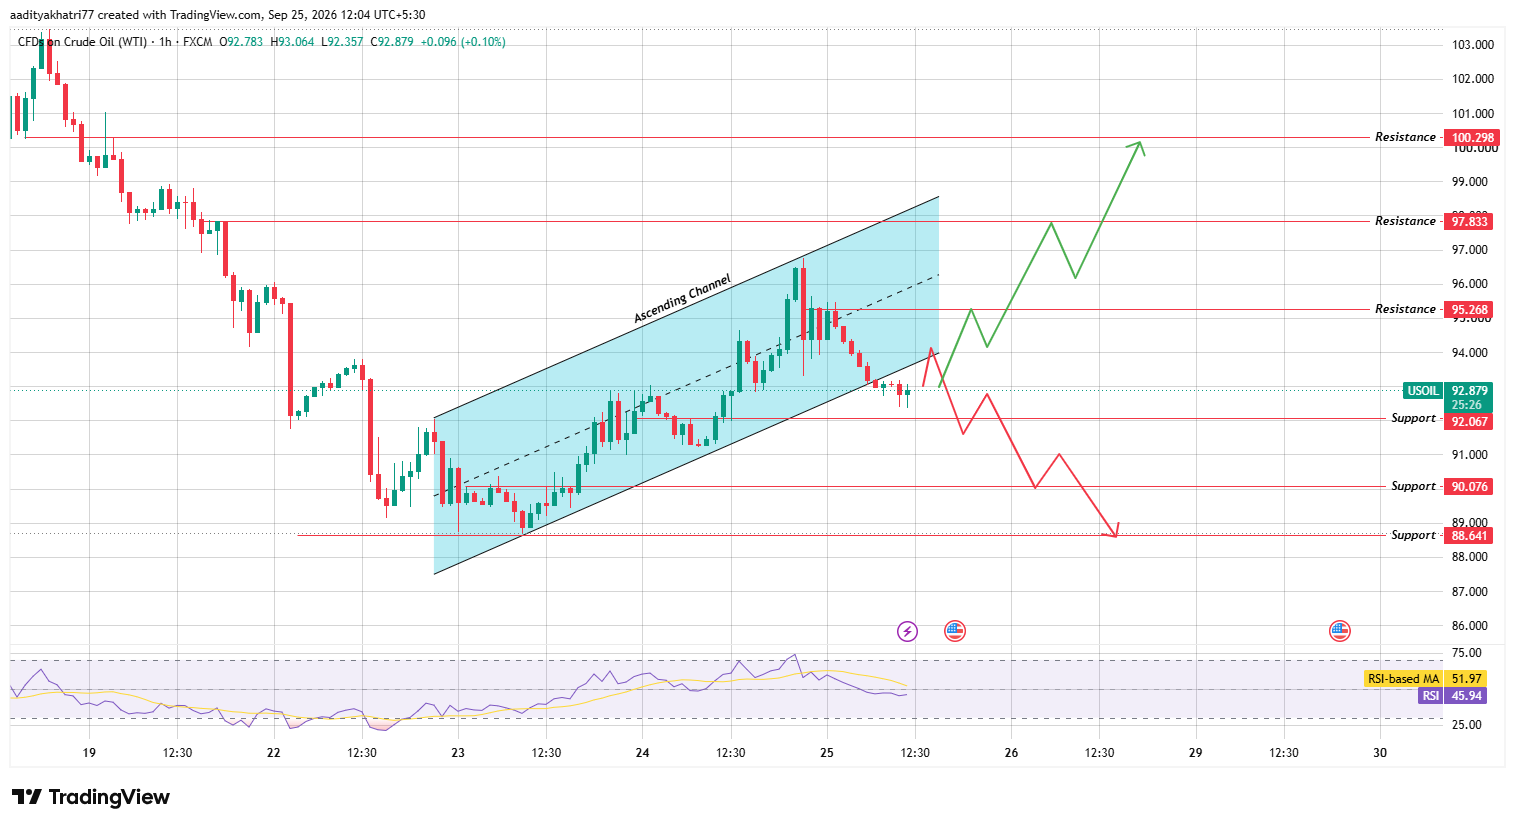
The hourly chart shows WTI had been climbing inside an ascending channel. Price broke below the lower boundary of that channel during this session, a shift that often signals fading short-term momentum.
Source: Chart taken from TradingView, as of Sep 25, 2026
The Relative Strength Index sits at 45.94, below its moving average of 51.97, reinforcing the weaker tone.
None of this happened in isolation. It followed a steady multi-day slide before the channel even formed, so the recent bounce and breakdown both need to be read against that longer backdrop.
Can WTI Reclaim the Channel and Push Toward Resistance?
A bounce from current levels, followed by a reclaim of the broken channel structure, would shift the setup back in favor of buyers.
The first resistance to watch sits at $95.268. Clearing that zone could open the door to $97.833, and a stronger move driven by supply concerns out of Russia might eventually test $100.298.
Refinery disruptions rarely resolve overnight, so any escalation there could accelerate this scenario faster than the chart alone would suggest.
What Happens If WTI Breaks Down Further?
If the price fails to recover and instead grinds toward support, the first level to watch is $92.067.
Losing that zone would expose WTI to $90.076, and a deeper breakdown could pull price toward $88.641.
This bearish path assumes the refinery situation does not escalate meaningfully from here, since a confirmed, sustained hit to Russian fuel output would likely limit how far a decline could run.
WTI Support and Resistance Levels
Support | Resistance |
$92.067 | $95.268 |
$90.076 | $97.833 |
$88.641 | $100.298 |
WTI Bull, Base, and Bear Scenarios
Scenario | Setup | Level |
Bull | Channel reclaim, resistance breaks amid supply concerns | $95.268 - $100.298 |
Base | Consolidation between broken channel and near support | $92.067 - $95.268 |
Bear | Refinery risk fades, and breakdown continues. | $90.076 - $88.641 |
WTI and the Global Oil Market
Crude oil prices rarely move on domestic supply and demand alone. Geopolitical risk, particularly disruptions tied to major producers like Russia, has repeatedly shown the power to override short-term technical signals.
The current standoff between a broken energy-infrastructure understanding and a bearish chart pattern is a clear example.
Markets will likely stay reactive to any further reporting on refinery damage or retaliation in the days ahead.
Methodology
This US Crude Oil price prediction draws on a review of the hourly WTI crude oil CFD chart, including channel structure, support and resistance zones, and RSI momentum readings.
Pricing data reflects live market quotes as of the article's publish time. The refinery strike details were drawn from public reporting shared on a geopolitical markets account, and this analysis should not be treated as trading or investment advice.
Expert Opinion
Energy market analysts have long noted that supply-side shocks, especially those hitting refining capacity rather than crude production itself, tend to move fuel prices faster than headline crude benchmarks.
Some also caution that markets often overreact to single incidents before settling once the actual scale of damage becomes clear, which is why confirmation of Perm's output loss will matter more than the initial headline.
Disclaimer: This article is for informational purposes only and does not constitute financial advice. Commodity markets are highly volatile and can move sharply on geopolitical developments. The price levels above are based on technical analysis and are not guaranteed outcomes. Readers should conduct their own research and consult a licensed financial advisor before making any trading decisions.

















