Bitcoin Cash Price Prediction: Will BCH Rally After $221.8?


Bitcoin Cash price prediction focus right now is on a tightening rising wedge pattern that has been building for more than two weeks, with price consolidating just under a level that could open the door to a much larger move.
This is a 4-hour timeframe technical setup rather than a longer horizon forecast, and it should be read with that scope in mind.
The levels discussed below come from the 4-hour BCH/USDT perpetual chart on Bybit and should be rechecked if the price closes meaningfully outside the range covered in this analysis.
In this article: Key Takeaways, BCH Price Right Now, Methodology, Liquidation Snapshot, Chart Analysis, Long-Term Targets, Technical Snapshot, Support and Resistance, Risk-Reward, What Would Change This Prediction, Bitcoin Sentiment Link, Update Trigger, Glossary, Bull/Base/Bear Case, Disclaimer.
Bitcoin Cash Price Right Now
Metric | Value |
Price (CMP) | $216.7 |
24H Change | +0.43% |
Futures Volume (24H) | $95.99M |
Spot Volume (24H) | $4.95M |
Market Cap | $4.35B |
Open Interest | $292.08M |
Circulating Supply | 20.07M BCH |
Total Supply | 20.07M BCH |
Max Supply | 21.00M BCH |
Open interest is the total value of open futures contracts that have not yet been settled, and a reading near 292 million dollars against a 4.35 billion dollar market cap shows a fairly active leveraged trading base relative to BCH's overall size.
Volume, open interest, and liquidation figures below are CoinGlass's aggregated market-wide data across tracked exchanges, not limited to a single venue like Bybit.
Chart source: TradingView, BCH/USDT Perpetual Contract 4-hour, Bybit (chart as supplied for this analysis), captured August 10, 2026, 13:47 IST (08:17 UTC). Market data source: CoinGlass Bitcoin Cash data page, captured August 10, 2026 (approximate same window).
Methodology and Data Sources
This Bitcoin Cash price prediction is built from a live 4-hour price chart with a hand-marked rising wedge pattern, plus real-time market data and liquidation figures pulled from CoinGlass.
No external analyst forecasts or projected price models have been added; the levels reflect only what the chart and data show at capture time.
For BCH's broader price hub and related coverage, see Bitcoin Cash price page.
Bitcoin Cash Liquidation Snapshot
Liquidation flow over the shortest windows leans toward short-sighted pain.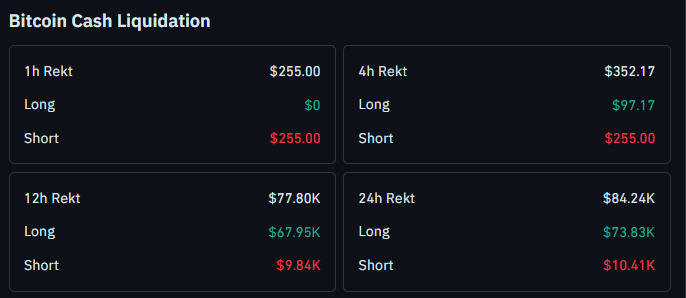
Over the past hour, $255.00 in liquidations came entirely from shorts, with nothing on the long side.
Over 4 hours, total liquidations reached $352.17, split between $97.17 in longs and $255.00 in shorts.
The picture flips over the longer windows. Over 12 hours, $67.95K in longs were liquidated against $9.84K in shorts, for a total of $77.80K rekt.
Over 24 hours, long liquidations reached $73.83K against $10.41K in shorts, for a total of $84.24K rekt.
This shift from short-side pain in the near term to long-side pain over the full day points to two-sided volatility inside the current wedge.
Source: CoinGlass Bitcoin Cash Liquidation data page, captured August 10, 2026.
Bitcoin Cash Trend and Momentum: Key Takeaways
BCH is trading around 216.7 dollars, the current market price, flat on the 4-hour candle at 0.00% change
Price is currently consolidating inside a rising wedge pattern on the 4-hour chart
A close above 221.8 confirms a breakout, with 229.2 as the next resistance and 242.2 further out if price sustains above that zone
A close below 208.4 confirms a breakdown toward 204.1 as the next support
The chart's momentum indicator flagged a bearish signal near the late July high and a bullish signal near the mid-July low and now sits near neutral at 54.66.
These target levels come from recent swing highs and lows marked directly on the chart
CMP in this article refers to the current market price, the live price BCH was trading at when this chart and data were captured.
Rekt, used in the liquidation section below, is common trading shorthand for the total dollar value of positions forcibly closed out.
These figures reflect a single snapshot in time and should be treated as reference points rather than fixed guarantees.
Bitcoin Cash 4-Hour Chart Analysis
BCH has spent the past two weeks climbing inside a rising wedge, a pattern formed by two converging upward-sloping trendlines.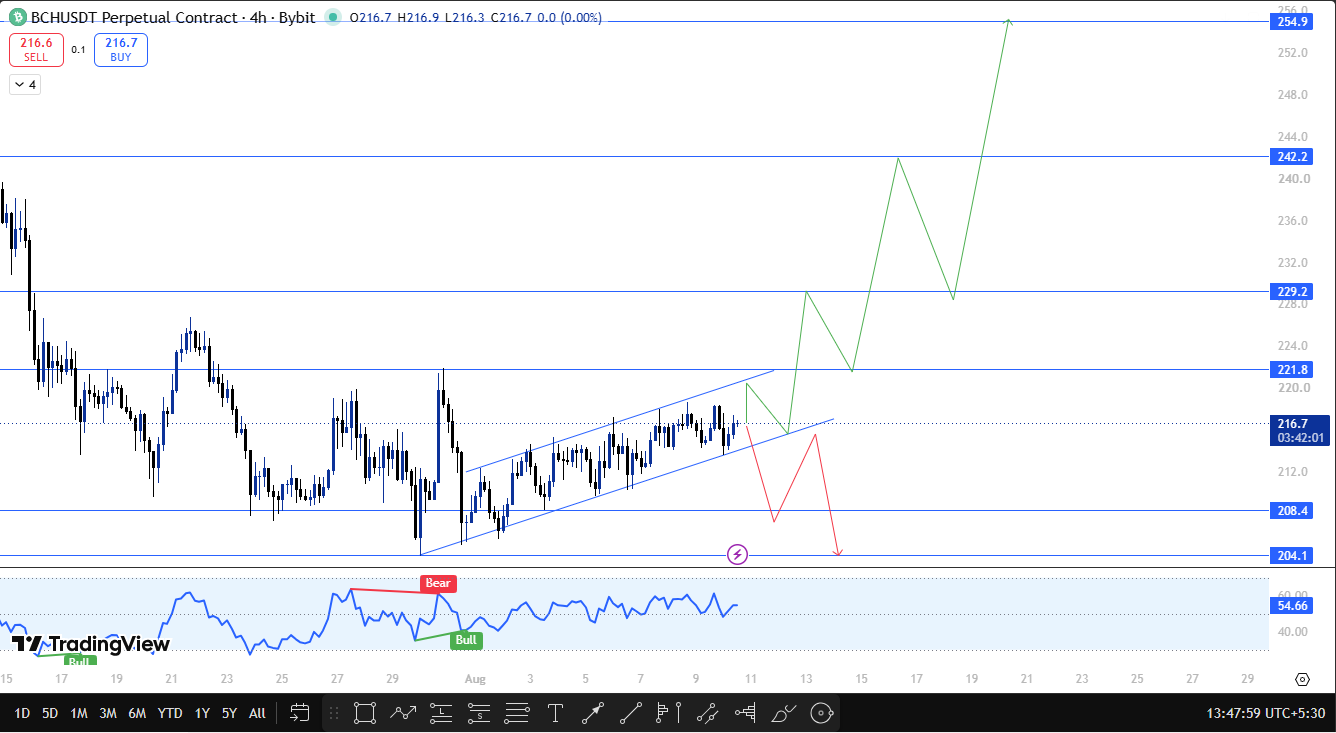
Price has been grinding higher within this structure, with the wedge tightening as the upper and lower boundaries move closer together, a setup that often resolves with a sharp move once price finally breaks out of the range.
The 221.8, 229.2, 242.2, 208.4, and 204.1 levels used throughout this piece are drawn directly from recent swing highs and lows marked on the chart, not independently calculated.
A confirmed close above 221.8, ideally supported by rising volume rather than a single low volume wick, would mark a validated breakout.
The first resistance to watch after that is 229.2, and if BCH sustains above that zone, 242.2 comes into view as the next level, with 254.9 marked as the furthest target on this chart if the rally extends.
If instead BCH closes below 208.4, that would mark a breakdown from the wedge, with 204.1 as the next support to watch.
The chart's momentum indicator flagged a bearish signal near the late July high, which lined up with a brief pullback, and a bullish signal near the mid-July low where buyers stepped back in.
The indicator currently reads 54.66, sitting in fairly neutral to mildly bullish territory as price consolidates inside the wedge.
The specific indicator name and settings were not labeled on the supplied chart, so this reading should be treated as a general momentum gauge rather than a precisely calibrated signal.
Bitcoin Cash Long-Term Price Targets
Beyond the immediate 221.8 breakout trigger, the chart also maps out extended targets for a longer-running move if BCH clears its nearer resistance levels.
Once 229.2 gives way and price sustains above that zone, 242.2 becomes the next target, with 254.9 marked as the furthest upside level on this chart, a possible longer horizon continuation if the breakout carries through.
These longer range levels depend entirely on BCH first confirming the 221.8 breakout and then holding above 229.2, so they should be treated as directional waypoints for an extended rally rather than a fixed timeline.
Bitcoin Cash Technical Outlook Snapshot
Indicator | Signal |
4-Hour Pattern | Rising wedge, still consolidating |
Momentum Indicator (RSI) | Reads 54.66, prior bearish signal near the late July high, bullish signal near the mid-July low |
Structure Above CMP | Resistance cluster at 221.8, 229.2, 242.2, 254.9 |
Structure Below CMP | Support cluster at 208.4, 204.1 |
BCH Support and Resistance Levels to Watch
Type | Level | Note | % From CMP (calculated) |
Resistance | $254.9 | Furthest long-term upside target, recent swing high | +17.64% |
Resistance | $242.2 | Longer range target if price sustains above 229.2, recent swing high | +11.77% |
Resistance | $229.2 | First resistance after breakout confirms recent swing high | +5.77% |
Resistance | $221.8 | Trigger level needs a close above to confirm breakout, recent swing high | +2.35% |
Support | $208.4 | Trigger level needs a close below to confirm breakdown, recent swing low | -3.83% |
Support | $204.1 | Next support on continued breakdown, recent swing low | -5.81% |
Bitcoin Cash Risk-Reward Table
Case | Trigger | Target |
Bullish | Close above $221.8 | $229.2, extended targets of $242.2 and $254.9 if sustained |
Bearish | Close below $208.4 | $204.1 |
It is worth noting the general risks around trading these levels.
False breakouts are common when a wedge pattern is nearing resolution, particularly on a close that is not backed by stronger than average volume, and leveraged positions near either trigger carry added liquidation risk given the two-sided liquidation activity already shown above.
What Would Change This BCH Price Prediction?
This setup rests on two specific closes, above 221.8 or below 208. 4.
If BCH instead keeps grinding sideways inside the wedge without a decisive close on either side, the pattern stays unresolved, and this piece would need revisiting with fresh chart data.
How Bitcoin Sentiment Could Move BCH
BCH tends to track Bitcoin's broader direction closely given the shared lineage between the two networks. A strong Bitcoin move could speed up or delay BCH's reaction at either the 221.8 or 208.4 level.
Update Trigger: When This Bitcoin Cash Price Prediction Gets Revisited
This piece will be revisited once BCH delivers a confirmed close above 221.8 or below 208.4 on the 4-hour chart, or once a significant Bitcoin move materially shifts the setup described above.
All price, volume, open interest, and liquidation figures here should be treated as of the stated capture time and refreshed once either trigger level breaks.
Glossary
CMP: current market price, the live price at the time this data was captured
Rekt: trading shorthand for the total dollar value of leveraged positions forcibly liquidated
Open Interest: the total value of outstanding futures contracts not yet settled
Liquidation: the forced closing of a leveraged position when losses exceed the trader's margin
Rising Wedge: a chart pattern formed by two upward-sloping, converging trendlines, often resolving with a sharp breakout or breakdown once price exits the range
Swing High/Low: a recent local peak or trough in price used as a reference point for support and resistance
Bull, Base, and Bear Case
Bull Case
BCH closes above $221.8 with supporting volume, confirming the wedge breakout and opening a path toward $229.2, with $242.2 and $254.9 as longer-term extended targets if price sustains above the nearer levels.
Base Case
BCH continues to consolidate inside the rising wedge between $208.4 and $221.8 without a decisive close on either side, keeping the pattern unresolved in the near term.
Bear Case
BCH closes below $208.4, confirming a breakdown from the wedge, with $204.1 as the next level to watch.
Disclaimer
This article is for informational purposes only and should not be treated as financial advice. Cryptocurrency markets are highly volatile, and prices can move sharply in either direction. Please do your own research and consult a qualified financial advisor before making any investment decisions. CoinGabbar and the analyst do not hold a position in BCH at the time of publication.

















