Bitcoin Cash Price Prediction: Can BCH Reach $400 Soon?


This Bitcoin Cash price prediction lands at a moment where the chart has gone quiet before what could be a loud move.
BCH has spent the last few sessions compressing into a tighter and tighter range, the kind of setup that usually resolves with a sharp breakout or breakdown once it runs out of room.
Which way that resolution goes is exactly what this Bitcoin Cash technical analysis is built to track.
The levels below come from a 1-hour chart and reflect a short-term technical view, not a guaranteed outcome.
Bitcoin Cash Price Right Now: Live Data and Key Levels
| Metric | Value |
| CMP (Current Market Price) | $270.7 |
| 24-Hour Change | -0.75% |
| Market Cap | $5.43 billion |
| Futures Volume (24h) | $258.14 million |
| Spot Volume (24h) | $35.08 million |
| Open Interest | $456.47 million |
| Circulating Supply | 20.07 million |
| Total Supply | 20.07 million |
| Max Supply | 21.00 million |
Futures volume of $258.14 million against spot volume of $35.08 million works out to roughly 7.4 times more futures activity than spot, an independently calculated ratio confirming leveraged traders are dominating activity inside this consolidation.
Open interest of $456.47 million against a $5.43 billion market cap puts leverage exposure near 8.4% of market cap, a moderate reading that leaves room for a sharp move once the triangle resolves.
Source: CoinGlass live market data, August 24, 2026, 15:58 IST. Chart source: TradingView, BCH/USDT Perpetual, Bybit, 1-hour timeframe.
Methodology Behind This Bitcoin Cash Price Prediction Today
This Bitcoin Cash price outlook is built on the 1-hour BCHUSDT perpetual chart on Bybit, viewed through TradingView.
CMP is taken from the live price marked on that chart, and target and support levels are pulled directly from recent levels marked on the same chart.
BCH Liquidation Data Today
The liquidation data shows a shift happening in real time.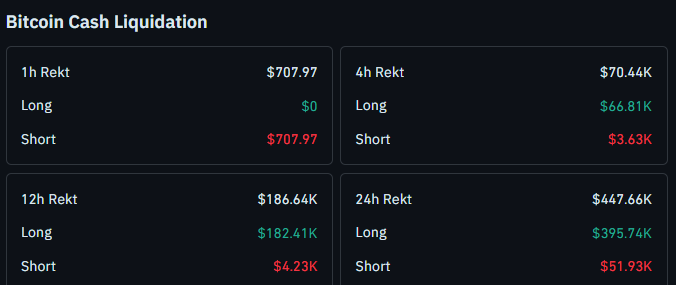
In the past hour, liquidations were light and entirely short-side, with $707.97 wiped out on shorts and nothing on the long side, a small sign of buyers testing the upper edge of the range.
Widen the window and the story flips.
The 4h window shows $66.81K in long-side liquidations against just $3.63K short-side, the 12h window shows $182.41K long-side against $4.23K short-side, and the 24h window shows $395.74K long-side against $51.93K short-side.
That consistent long-side dominance over the longer windows points to a downtrend into the triangle that has caught leveraged buyers repeatedly, with only the most recent hour hinting at a possible shift toward shorts getting squeezed instead.
Source: CoinGlass liquidation data, August 24, 2026, 15:58 IST.
BCH Trend and Momentum: Key Takeaways for Traders
-
BCH is trading inside a symmetrical triangle on the 1-hour chart, with price action compressing tighter from session to session
-
CMP is trading near $270.7, down about 0.75% over the past 24 hours per CoinGlass
-
A break and 1h close above $305.6 opens the path toward $350.4, then $417.8 on continued strength
-
A break and 1h close below $261.6 would confirm a symmetrical triangle breakdown, with $241.3 as the next support zone
-
Long-side liquidations have dominated the 4h, 12h, and 24hr windows, though the most recent hour flipped to a small short-side liquidation
-
The built-in momentum panel has cooled from earlier bear-tagged pressure down to a near-neutral reading
These levels reflect a short-term, 1-hour setup. Triangle breakouts can produce false moves before the real direction confirms, so treat these as levels to watch rather than certainties.
Bitcoin Cash Price Prediction: 1-Hour Chart Analysis
BCH is coiling inside a symmetrical triangle, with lower highs and higher lows squeezing the price into a narrower range as the session progresses.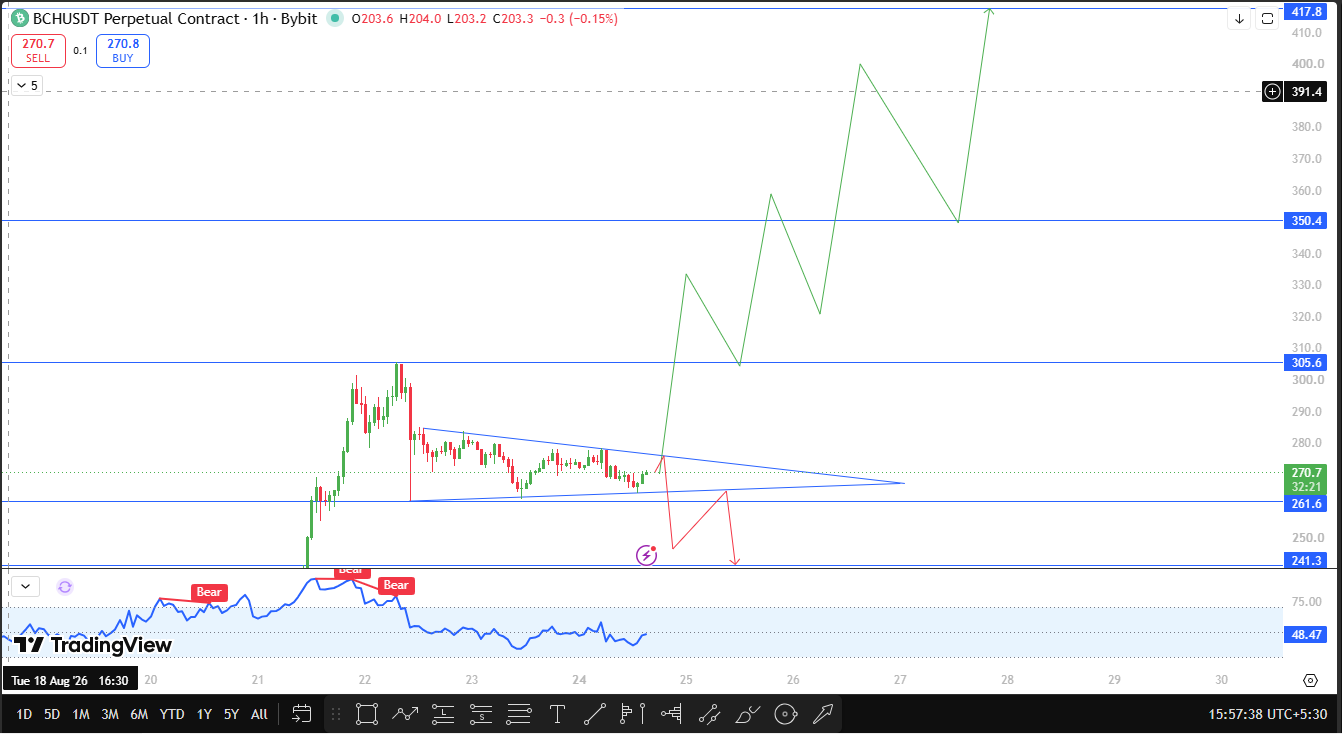
This kind of BCH support and resistance compression usually builds up energy for a bigger move once one side of thepattern finally gives way.
The built-in momentum panel flagged bear tags three times as the pattern formed, but that pressure has eased, with the oscillator now sitting near 48.47, close to the midpoint rather than deep in bearish territory.
If BCH breaks and closes on the 1h above $305.6, that confirms an upside resolution out of the pattern.
From there, the next resistance is $350.4, and a continuation beyond that brings $417.8 into view as the next marked level above, an extended target for this BCH price forecast if momentum keeps building.
On the downside, a break and 1-hour close below $261.6 would confirm the symmetrical triangle has broken down instead.
Losing that level opens room toward the $241.3 support zone, the next level below it.
Technical Outlook Snapshot for This Bitcoin Cash Price Prediction
| Indicator | Signal |
| Chart Pattern | 1-hour symmetrical triangle, price compressing into a tighter range |
| Momentum Panel (TradingView, 1H) | Near 48.47, easing from earlier bear-tagged pressure |
| Near-Term Bias | Neutral inside the pattern, resolution needs a 1-hour close outside $261.6 to $305.6. |
BCH Support and Resistance Levels Worth Watching Now
| Level Type | Price | % From CMP | Note |
| Extended Target | $417.8 | +54.34% | Recent chart level, extended target on sustained strength |
| Major Resistance | $350.4 | +29.44% | Recent chart high |
| Resistance (trigger) | $305.6 | +12.89% | Triangle upper boundary, breakout confirmation level |
| Current Price | $270.7 | 0% | Live CMP, Bybit perpetual, 1H chart |
| Support (trigger) | $261.6 | -3.36% | Triangle lower boundary, breakdown confirmation level |
| Support Zone | $241.3 | -10.86% | Next support zone below |
BCH Risk-Reward Table for the Triangle Breakout Setup
| Case | Trigger | Target |
| Bull Case | Sustained 1-hour close above $305.6 | $350.4, then $417.8 on continued strength |
| Bear Case | Break and 1-hour close below $261.6 | $241.3 |
| Setup invalidation | Price stays trapped between $261.6 and $305.6. | Triangle unresolved, no directional bias confirmed |
Invalidation Level for This Bitcoin Cash Price Forecast
This Bitcoin Cash price forecast stays neutral while the price remains between $261.6 and $305.6.
A break and 1-hour close beyond either boundary is what confirms the next directional move, with $305.6 favoring the bull case and $261.6 favoring the bear case.
How Bitcoin Sentiment Could Move This BCH Price Outlook
Price, sharing its lineage with Bitcoin, tends to take direction from the broader tone Bitcoin sets across the market, often more closely than other large-cap alts.
Strength in Bitcoin could help Price clear $305.6 faster, while a sudden shift lower in Bitcoin could be the trigger that pushes BCH below $261.6.
This Bitcoin Cash price prediction is based on BCH's own chart structure, but Bitcoin remains a factor worth watching alongside it.
Planned Update for This Bitcoin Cash Price Prediction
This BCH price prediction will be revisited if the price closes decisively above $305.6 or below $261.6, or if fresh liquidation data meaningfully shifts the current setup.
Glossary of Terms Used in This BCH Technical Analysis
-
CMP: Current Market Price, the live traded price at the time of analysis
-
Open Interest: The total value of outstanding, not yet settled derivative contracts for an asset
-
Long-Side Liquidation: A forced closure of leveraged buy positions, typically triggered when price falls
-
Short-Side Liquidation: A forced closure of leveraged sell positions, typically triggered when price rises
-
Symmetrical Triangle: A consolidation pattern formed by converging lower highs and higher lows, typically resolving with a breakout in either direction
CoinGabbar Technical Analyst View on BCH Price Action
Bull Case: A sustained 1-hour close above $305.6 confirms an upside triangle breakout, opening a path toward $350.4 and $417.8, supported by the recent easing of long-side liquidation pressure.
Base Case: Price continues coiling between $261.6 and $305.6 as the triangle tightens further, with liquidations staying light until one boundary breaks.
Bear Case: A break and 1h close below $261.6 confirms a triangle breakdown and opens room toward the $241.3 support zone, consistent with the long-side liquidation pressure that has dominated the 4-hour through 24-hour windows.
Disclaimer
This article is for informational purposes only and should not be treated as financial advice. Cryptocurrency markets are highly volatile, and readers should do their own research before making any investment decisions. CoinGabbar and the analyst do not hold a position at the time of publication.
Also read:












.webp)




