BNB Price Prediction: BNB Bulls Eye $650 After Breakout


BNB price prediction watchers have a fresh setup to work with this week. Binance Coin has spent the past couple of weeks compressing into a tightening pattern on the chart, right as a major institutional fund allocation put BNB in headlines for reasons that have nothing to do with candlesticks.
On this page: Price Right Now · Methodology · Grayscale Fund News · Liquidation Data · Key Takeaways · Chart Analysis · Support and Resistance · Risk-Reward · Bull, Base, Bear Case · Glossary · Disclaimer
This breakdown uses chart structure, CoinGlass data, and the ecosystem news supplied for this piece. It is meant purely for informational purposes and is not financial advice. CoinGabbar and the analyst preparing this article do not hold a position in BNB at the time of publication.
The levels discussed here come from the 4-hour $BNB perpetual chart and represent a short-term view. If the price moves decisively outside these ranges, this price prediction should be revisited rather than assumed to still apply.
Binance Coin (BNB) Price Right Now
Metric | Value |
Current Price (CMP) | $602.56 |
24-Hour Change | +0.17% (+1.0226) |
Market Cap | $80.14B |
Futures Volume (24h) | $322.52M |
Spot Volume (24h) | $60.19M |
Open Interest | $999.05M |
Circulating Supply | 133.16M |
Total Supply | 133.16M |
Max Supply | 133.16M |
Open interest is sitting just under the $1B mark, meaning the total value of BNB futures and perpetual contracts, derivatives with no expiry date that let traders hold leveraged long or short positions, still open across the market is close to that threshold.
With price compressing into a wedge, that much open leverage means whichever direction BNB breaks could see an outsized reaction as positions get forced to adjust.
Chart source: TradingView, BNB/USDT Perpetual Contract, Binance, 4-hour timeframe, captured 19 August 2026. Data source: CoinGlass, BNB market page, captured 19 August 2026.
Methodology and Data Sources
The structure behind this BNB price outlook comes from a direct reading of the 4-hour Binance Coin perpetual chart on Binance, tracking the falling wedge pattern and the horizontal levels marked on it.
Market figures such as volume, open interest, and supply data are pulled from CoinGlass, liquidation numbers come from CoinGlass's liquidation tracker for BNB, and the institutional allocation figures below are sourced from a public X post citing Grayscale's Q2 2026 rebalancing.
BNB Lands Top Spot in Grayscale's Smart Contract Fund
A notable institutional development adds context to this Binance Coin forecast beyond the chart itself.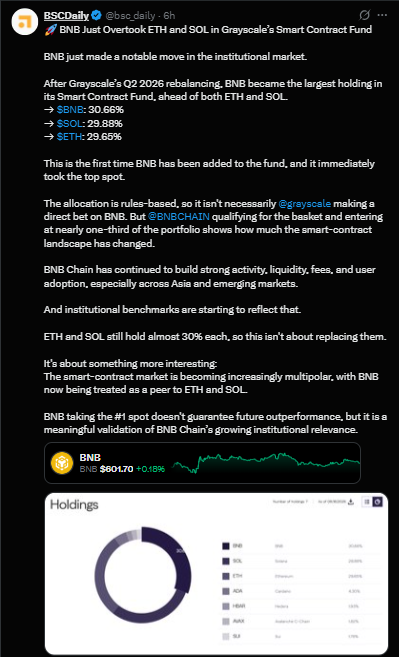
Following Grayscale's Q2 2026 rebalancing, $BNB became the largest holding in its Smart Contract Fund, edging out both ETH and SOL, at 30.66% versus SOL's 29.88% and ETH's 29.65%. This marks the first time $BNB has been added to the fund, and it took the top spot immediately upon entry.
The allocation itself is rules-based rather than a discretionary bet by Grayscale on $BNB specifically, but $BNB Chain qualifying for close to a third of the fund's portfolio still reflects how much the smart-contract landscape has shifted.
The post attributes this to BNB Chain's sustained activity, liquidity, fee generation, and user adoption, particularly across Asia and emerging markets.
With ETH and SOL both still holding close to 30% each, this looks less like BNB replacing either asset and more like the smart-contract market becoming multipolar, with BNB now treated as a peer rather than a distant third.
Taking the top spot does not guarantee future outperformance, but it is a meaningful signal of BNB Chain's growing institutional relevance.
Source: @bsc_daily on X, August 19, 2026, approximately 6 hours before this piece was compiled.
$BNB Liquidation Data Today
Liquidation flow on coin right now is skewing toward longs, a pattern that lines up with price grinding lower inside the wedge rather than breaking out cleanly.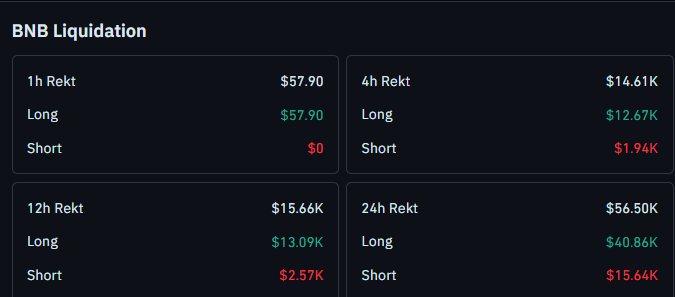
The last hour saw $57.90 in total liquidations, entirely from long positions, with $0 from shorts.
The 4-hour window shows $14.61K in total liquidations, made up of $12.67K in long-side liquidations against $1.94K in short-side liquidations.
Zooming out to 12 hours, total liquidations reach $15.66K, with $13.09K from longs and $2.57K from shorts.
Across the full 24 hours, total liquidations hit $56.50K, split between $40.86K in long-side liquidations and $15.64K in short-side liquidations.
Longs have taken the bulk of the pain across every timeframe here, consistent with a market still compressing under the wedge's downward-sloping resistance rather than confirming a breakout.
Source: CoinGlass, BNB liquidation data, captured August 19, 2026.
$BNB Trend and Momentum: Key Takeaways
Coin is trading at $602.56, currently compressing inside a falling wedge on the 4-hour chart
A confirmed 4-hour close above 612.42 opens the door to 633.19, then 652.21 as the next resistance levels
A break with a close below 597.50 shifts focus down to 585.72 as the next support
Grayscale's Q2 2026 rebalancing just made $BNB the top holding in its Smart Contract Fund, ahead of both ETH and SOL
Long-side liquidations are dominating across every timeframe, consistent with the wedge's downward pressure rather than a confirmed breakout
Leveraged positions around any of these zones carry real liquidation risk, as the numbers above show.
These levels describe a chart-based framework, not a guarantee of what comes next.
Binance coin Price Prediction: 4-Hour Chart Analysis
Price has spent the past couple of days trading inside a falling wedge, a pattern formed by two converging downward-sloping trendlines, and price is now approaching the apex, where that compression typically resolves one way or the other.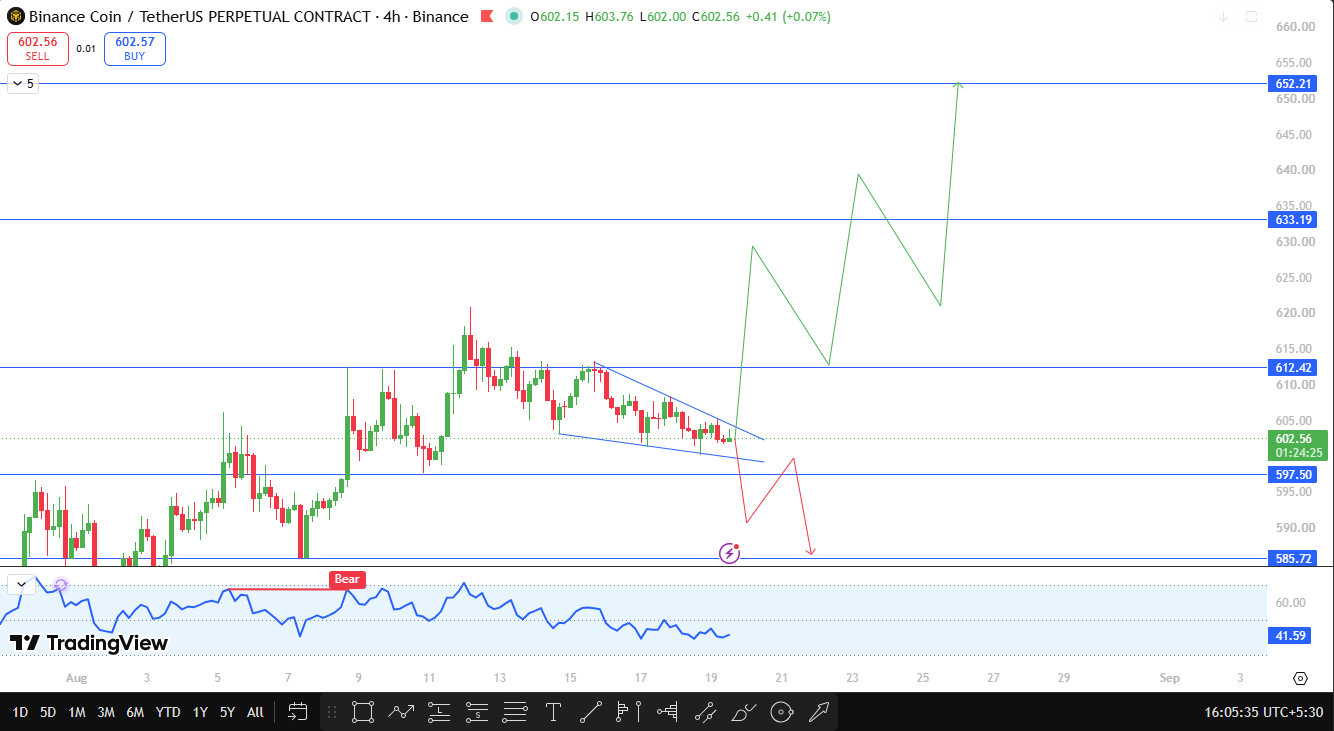
The chart's momentum indicator currently reads 41.59, below the neutral 50 mark, with an earlier bearish divergence tag visible from early August.
A falling wedge with soft momentum readings during its formation is a fairly normal setup, since the pattern often reflects fading selling pressure even while the oscillator stays subdued, so this reading alone should not be read as a bearish signal on its own.
If BNB breaks out and closes above 612.42 on a 4-hour candle, the next resistance in view is 633.19, followed by 652.21 further above.
If instead price breaks down and closes below 597.50, the next support to watch is 585.72.
$BNB Technical Outlook Snapshot
Indicator | Signal |
Price Structure | Falling wedge, price compressing near the apex |
Momentum Oscillator RSI | Reading near 41.59, a bearish divergence tag visible from early August |
Immediate Bias | Neutral to cautiously bullish while wedge compression continues |
Bullish Trigger | 4-hour close above 612.42 |
Bearish Trigger | 4-hour close below 597.50 |
Invalidation | 4-hour close below 585.72 |
$BNB Support and Resistance Levels to Watch
Type | Level | Note | % From CMP |
Resistance | $652.21 | Second resistance target | +8.24% |
Resistance | $633.19 | First resistance target | +5.08% |
Resistance | $612.42 | Wedge breakout trigger | +1.64% |
Current Price | $602.56 | Live CMP | 0% |
Support | $597.50 | Wedge breakdown trigger | -0.84% |
Support | $585.72 | Next support on breakdown | -2.79% |
$BNB Risk-Reward Table
Case | Trigger | Target |
Bullish breakout | 4-hour close above 612.42 | 633.19, then 652.21 |
Bearish breakdown | 4-hour close below 597.50 | 585.72 |
Setup invalidation | 4-hour close below 585.72 | Broader wedge structure at risk |
Invalidation Level
This BNB price forecast treats a 4-hour close below 585.72 as invalidation for the current wedge-based structure. Below that level, the case for a bullish wedge resolution weakens considerably, and the setup would need a full reassessment.
Trading around any of these zones on leverage carries genuine risk.
A false breakout in either direction is possible before the wedge truly resolves, and the liquidation data above shows how fast overleveraged positions can get wiped out during these moves.
How Bitcoin Could Influence $BNB
Bitcoin sentiment remains relevant for this BNB crypto forecast, even with BNB's own chart pattern doing most of the work right now.
A stable or rising Bitcoin would likely help BNB clear 612.42 and extend toward 633.19 and 652.21 with less resistance.
A risk-off shift in Bitcoin, by contrast, would make a wedge breakdown below 597.50 more likely, even with the Grayscale allocation news looking constructive for BNB's longer-term institutional standing.
Planned Update
This price prediction will be revisited if price closes a 4-hour candle beyond either 652.21 or 597.50, or if no clear resolution happens within the next 24 to 48 hours.
A meaningful shift in institutional allocation news or a large liquidation event would also be reason enough to update this BNB technical outlook sooner.
Glossary
Falling Wedge: A chart pattern formed by two converging downward-sloping trendlines, typically watched for a breakout once price compresses near the apex.
Open Interest: The total value of outstanding futures or perpetual contracts that remain open and unsettled.
Liquidation: The forced closing of a leveraged position by an exchange once losses erode a trader's required margin.
Perpetual Futures: Derivatives contracts with no expiry date, letting traders hold leveraged long or short exposure indefinitely.
Invalidation Level: The price point at which a technical outlook is no longer considered valid, requiring the setup to be reassessed.
CoinGabbar's Technical Analyst View
Bull Case: Price holds the wedge structure, breaks out with a 4-hour close above 612.42, and clears 633.19 before extending toward 652.21 as institutional interest from the Grayscale allocation adds a supportive backdrop.
Base Case: Price continues compressing inside the wedge without a decisive close above 612.42 or below 597.50, resulting in a choppy, range-bound stretch as the market digests both the technical setup and the fund news.
Bear Case: Price closes below 597.50, breaking down out of the wedge, and slides toward 585.72, with continued weakness putting the broader structure at risk below 585.72.
Disclaimer
This price prediction is prepared for informational purposes only and should not be treated as financial or investment advice. Cryptocurrency markets, including BNB, are highly volatile, and leveraged trading carries significant risk of loss, including liquidation, as shown in the data above. Readers should conduct their own research and consult a qualified financial advisor before making any investment decisions. CoinGabbar and the analyst preparing this piece do not hold a position at the time of publication.







.webp)








