BNB Price Prediction: BNB Eyes a $746 Breakout


BNB price prediction watchers have had a good few weeks, and the chart makes it obvious why.
A strong ascending trendline has carried Binance Coin nearly 11% higher, and now the price is doing the harder part, actually holding its ground right at resistance instead of getting knocked straight back down.
This breakdown uses chart structure, CoinGlass data, and BNB Chain network data supplied for this piece.
The levels discussed here come from the 4-hour BNB perpetual chart and represent a short-term view.
If the price moves decisively outside these ranges, this BNB price prediction should be revisited rather than assumed to still apply.
Binance Coin ($BNB) Price Right Now
Metric | Value |
Current Price (CMP) | $612.76 |
24-Hour Change | +0.13% (+0.7954) |
Market Cap | $81.69B |
Futures Volume (24h) | $455.59M |
Spot Volume (24h) | $57.66M |
Open Interest | $1.01B |
Circulating Supply | 133.16M |
Total Supply | 133.16M |
Max Supply | 133.16M |
Open interest currently sits above $1B, which is the total value of BNB futures contracts still open across the market.
A number this size right as price tests resistance means leveraged positioning could add real fuel to whichever direction BNB decides to break.
Chart source: TradingView, BNB/USDT Perpetual Contract, Binance, 4-hour timeframe, captured 13 August 2026, around 2:45 PM IST (09:15 AM UTC). Data source: CoinGlass, BNB market page, captured 13 August 2026, around 2:45 PM IST.
Methodology and Data Sources
The structure behind this price prediction comes from a direct reading of the 4-hour Binance Coin perpetual chart on Binance, tracking the ascending trendline and the horizontal resistance levels marked on it.
Market figures such as volume, open interest, and supply data are pulled from CoinGlass, liquidation numbers come from CoinGlass's liquidation tracker for BNB, and network activity figures are sourced from BNB Chain's own on-chain dashboard.
Binance coin Chain Network Activity Snapshot
Fresh on-chain data adds useful context to this Binance Coin forecast beyond just the price chart.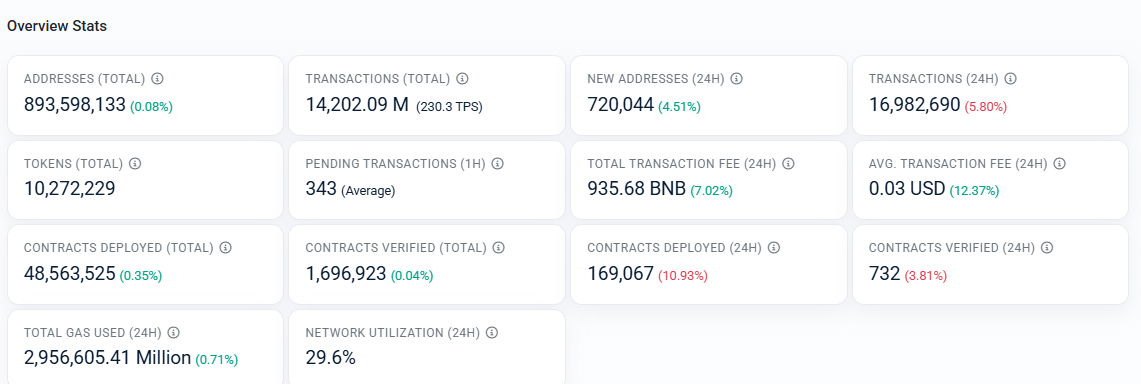
BNB Chain currently has 893,598,133 total addresses, up 0.08%, with 720,044 new addresses added in the last 24 hours, a jump of 4.51%.
Total transactions on the network have crossed 14,202.09M, processing at an average of 230.3 transactions per second, though the 24-hour transaction count actually dipped 5.80% to 16,982,690.
Total transaction fees paid in the last 24 hours came to 935.68 BNB, up 7.02%, even as the average fee per transaction fell 12.37% to just $0.03.
On the development side, 169,067 new contracts were deployed in the last 24 hours out of 48,563,525 total, while network utilization stands at 29.6%.
Rising new-address growth alongside falling average fees points to a network still seeing fresh user activity without congestion pushing costs higher, a healthy backdrop for this Binance coin technical analysis.
Source: BNB Chain network dashboard, captured 13 August 2026.
Liquidation Data Today
Liquidation flow on Binance coin right now is skewing heavily toward shorts, which lines up with price holding firm near resistance instead of breaking down.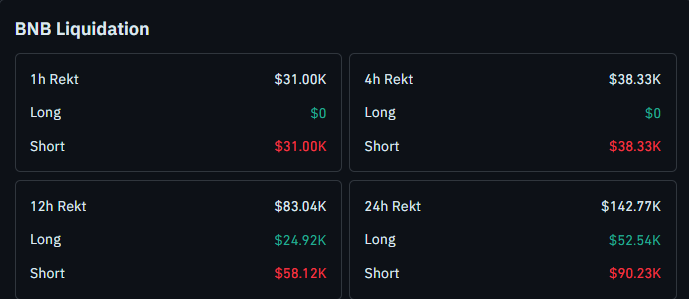
The last hour saw $31.00K in total liquidations, entirely from short positions, with longs at $0. The 4-hour window shows the same pattern, $38.33K in total liquidations, all of it from shorts.
Zooming out to 12 hours, rekt totals reach $83.04K, with $24.92K from longs and $58.12K from shorts.
Across the full 24 hours, total liquidations hit $142.77K, made up of $52.54K in longs and $90.23K in shorts.
Shorts have taken the bulk of the pain across every timeframe here, a pattern that fits a market grinding higher along a trendline rather than reversing sharply.
Source: CoinGlass, BNB liquidation data, captured 13 August 2026.
BNB Trend and Momentum: Key Takeaways
It is trading at 612.76, holding near resistance after a rally of nearly 11% off its ascending trendline
The trendline sits just below the current price and remains a second layer of support if it dips before continuing higher
A hold here, either at current levels or off the trendline, keeps 633.19 and 652.21 in view
A sustained move above that range opens the door to 746.44 as a major upside target
A trendline break with a close below 597.50 would shift focus down to 585.72
Short liquidations are dominating across every timeframe, consistent with the trendline holding so far
Leveraged positions around any of these zones carry real liquidation risk, as the numbers above show. These levels describe a chart-based framework, not a guarantee of what comes next.
BNB Price Prediction: 4-Hour Chart Analysis
It has been climbing steadily along a strong ascending trendline, and that single structure has done most of the heavy lifting, carrying the price up almost 11% from where the move began.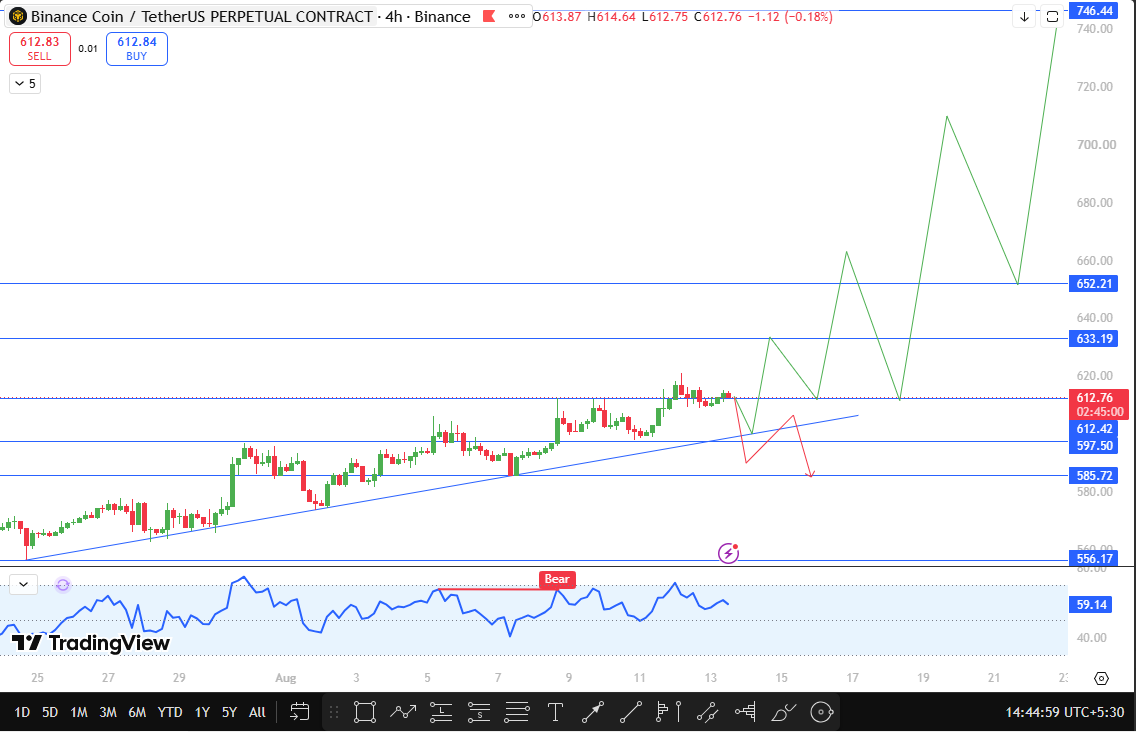
What matters for this Binance coin price prediction now is what happens right here at resistance.
Price is currently trading around this resistance zone without a clean rejection, which is often the first sign that a level is closer to breaking than holding.
The trendline itself sits just below the current price, giving BNB two separate ways to defend this zone rather than just one.
If it holds either right here or off the trendline on a pullback, the next resistance in view is 633.19, roughly 3.33% above CMP, followed by 652.21 near 6.44% higher.
Should price sustain above that range with real follow-through, this Binance Coin forecast extends much further, toward 746.44, close to 21.81% above CMP, a level that would mark a significant continuation of the current trend.
On the downside, the trendline break is the level to watch first.
A 4-hour close below 597.50, about 2.49% under CMP, would suggest the ascending structure has finally given way.
From there, 585.72 becomes the next support, roughly 4.41% lower, and would be the first real test of whether this broader uptrend can hold.
Technical Outlook Snapshot
Indicator | Signal |
Price Structure | Ascending trendline intact, price consolidating at resistance |
Momentum Oscillator RSI | Reading near 59.14, a recent bear tag is visible in the mid-range. |
Immediate Bias | Cautiously bullish while the trendline holds |
Bullish Trigger | Sustained hold above current resistance zone |
Bearish Trigger | 4H close below 597.50 |
Invalidation | 4H close below 585.72 |
Binance coin Support and Resistance Levels to Watch
Type | Level | Note | % From CMP |
Resistance | $746.44 | Major upside target on sustained strength | +21.81% |
Resistance | $652.21 | Second resistance target | +6.44% |
Resistance | $633.19 | First resistance target | +3.33% |
Current Price | $612.76 | Live CMP | 0% |
Support | $597.50 | Trendline breakdown trigger | -2.49% |
Support | $585.72 | Next support on breakdown | -4.41% |
Risk-Reward Table
Case | Trigger | Target |
Bullish continuation | Hold at resistance or trendline support. | 633.19, then 652.21 |
Extended bullish | Sustained move above 652.21 | 746.44 |
Bearish breakdown | 4H close below 597.50 | 585.72 |
Setup invalidation | 4H close below 585.72 | Broader uptrend structure at risk |
Invalidation Level
This $BNB price prediction treats a 4-hour close below 585.72 as invalidation for the current bullish structure.
Below that level, the case for BNB's ascending trendline still driving this rally weakens considerably, and the setup would need a full reassessment.
Trading around any of these zones on leverage carries genuine risk.
A false hold at resistance followed by a quick reversal is possible before either direction truly confirms, and the liquidation data above shows how fast overleveraged positions can get wiped out during these moves.
How Bitcoin Could Influence $BNB
Bitcoin sentiment remains relevant for this crypto forecast, even with BNB's own trendline doing most of the work so far.
A stable or rising Bitcoin would likely help $BNB clear 633.19 and 652.21 with less resistance.
A risk off shift in Bitcoin, by contrast, would make a trendline break below 597.50 more likely even with BNB Chain's network activity looking healthy right now.
Planned Update
This price prediction will be revisited if it closes a 4-hour candle beyond either 652.21 or 597.50, or if no clear resolution happens within the next 24 to 48 hours.
A meaningful shift in BNB Chain network activity or a large liquidation event would also be reason enough to update this BNB technical outlook sooner.
Glossary
Ascending Trendline: A rising support line connecting a series of higher lows, used to track an uptrend's structure.
Open Interest: The total value of outstanding futures or perpetual contracts that remain open and unsettled.
Liquidation: The forced closing of a leveraged position by an exchange once losses erode a trader's required margin.
Network Utilization: A measure of how much of a blockchain's available processing capacity is currently being used.
Invalidation Level: The price point at which a technical outlook is no longer considered valid, requiring the setup to be reassessed.
CoinGabbar's Technical Analyst View
Bull Case: Price holds its resistance zone or bounces from the trendline, clearing 633.19 and 652.21 before extending toward 746.44 on sustained strength.
Base Case: Price continues to consolidate near current resistance without a decisive close above 652.21 or below 597.50, resulting in a choppy, range-bound stretch as the market digests the recent rally.
Bear Case: Price closes below 597.50, breaking its ascending trendline, and slides toward 585.72, with continued weakness putting the broader uptrend structure at risk.
Disclaimer
This price prediction is prepared for informational purposes only and should not be treated as financial or investment advice. Cryptocurrency markets, including BNB, are highly volatile, and leveraged trading carries significant risk of loss, including liquidation as shown in the data above. Readers should conduct their own research and consult a qualified financial advisor before making any investment decisions. CoinGabbar and the analyst preparing this piece do not hold a position at the time of publication.
Also read:

















