Cash Cat Price Prediction: $100M Market Cap, All-Time High Rally Ahead


Cash Cat Price Right Now: The Numbers That Matter.
CASHCAT has cooled off sharply from its early-August highs, but it's still holding a market cap near $94M, and traders are watching whether this pullback finds a floor or turns into something deeper.
This Cash Cat Price Prediction looks at the volume and liquidation trends behind the drop and the key levels that could decide what comes next.
Market data was checked on August 19, 2026, at 15:50 IST.
Cash Cat Price Right Now: The Numbers That Matter
Metric | Value |
Price | $0.09446 |
24h Change | -8.94% |
Market Cap | $94.46M |
FDV | $94.46M |
24h Volume | $20.67M |
Vol/Mkt Cap (24h) | 22% |
Liq/Mkt Cap | 7.12% |
Total Supply | 1B CASHCAT |
Max Supply | 1B $CASHCAT |
Circulating Supply | 1B $CASHCAT |
Source: Data from CoinMarketCap as of August 19, 2026, at 15:50 IST. Figures may vary slightly across other tracking websites.
CASHCAT Volume and Liquidation Data: What the Charts Show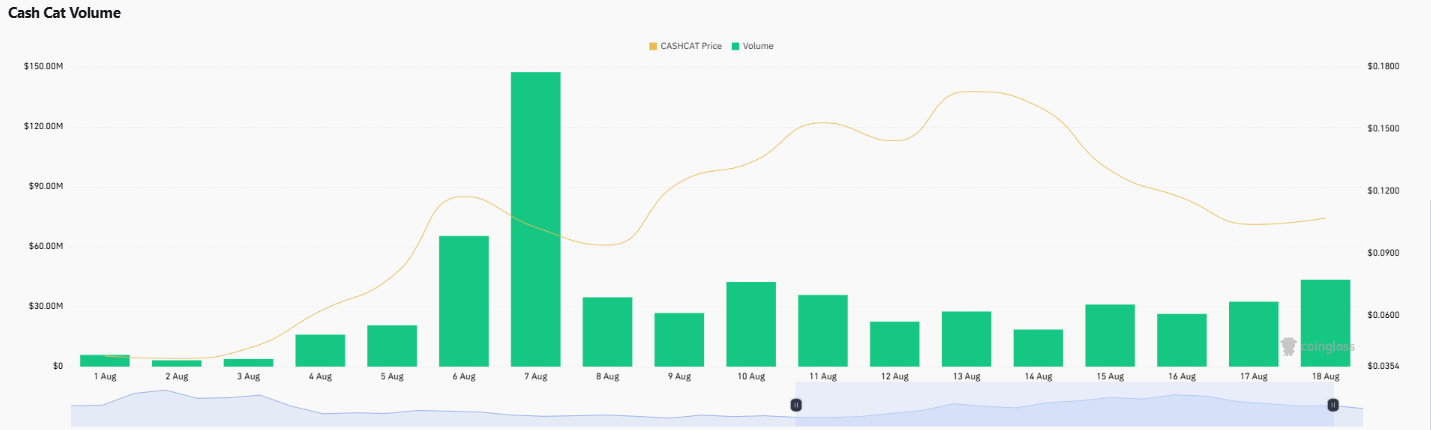
Daily volume spiked to nearly $150M on August 7, right as price was accelerating toward its peak, before cooling into a steadier $25M to $45M range through mid-August.
The most recent two sessions (Aug 17-18) show volume ticking back up, hinting at renewed interest even as price has pulled back.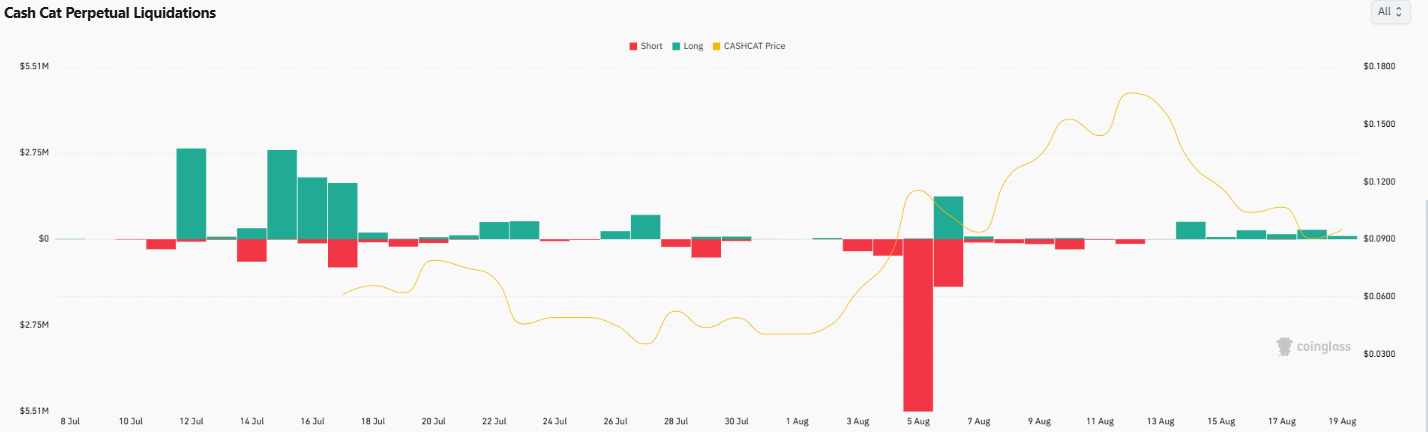
The liquidation history tells a sharper story.
On August 5, shorts got hit hard with over $2.5M wiped out in a single day, right before CASHCAT's price surged into its early-August rally, a classic short squeeze setup.
Since the mid-August top, liquidations have flipped smaller and more balanced, with modest long liquidations dominating as price has drifted lower, suggesting the recent pullback hasn't triggered the kind of leveraged panic seen in July.
What Traders Are Saying About CASHCAT
A post from trader Drallio on X argues that CASHCAT is the coin most "Robinhood chain" memecoins are chasing and that even with cooling volume, holding near a $100M market cap is notable.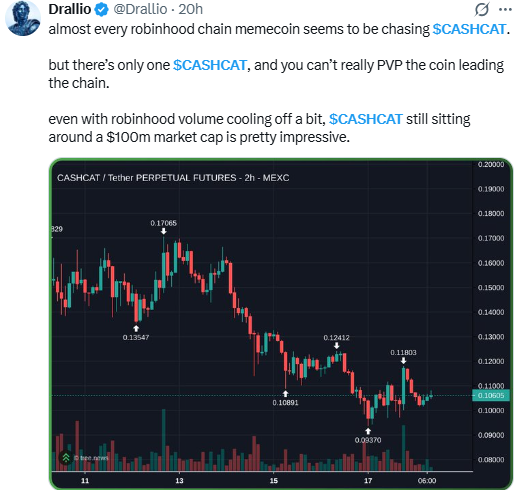
Source: Data From X
Note: This is the account's own opinion rather than verified data, but it reflects the broader narrative currently attached to CASHCAT.
Cash Cat Price Prediction Chart: Technical Analysis
Pair: CASHCAT/USDT · Market: Spot (Crypto) · Timeframe: 1D · Source: TradingView · Timestamp: August 19, 2026, 15:50 UTC+5:30
CASHCAT rallied sharply from around $0.034702 to a peak near $0.166134 in early-to-mid August before rolling over into a descending channel.
The price broke below that channel and is now consolidating right around $0.094658, sitting just above a key support level.
CASHCAT's daily RSI sits at 47.68, right around neutral.
If the price holds the support, it can move higher; if it breaks below it, selling pressure can emerge. 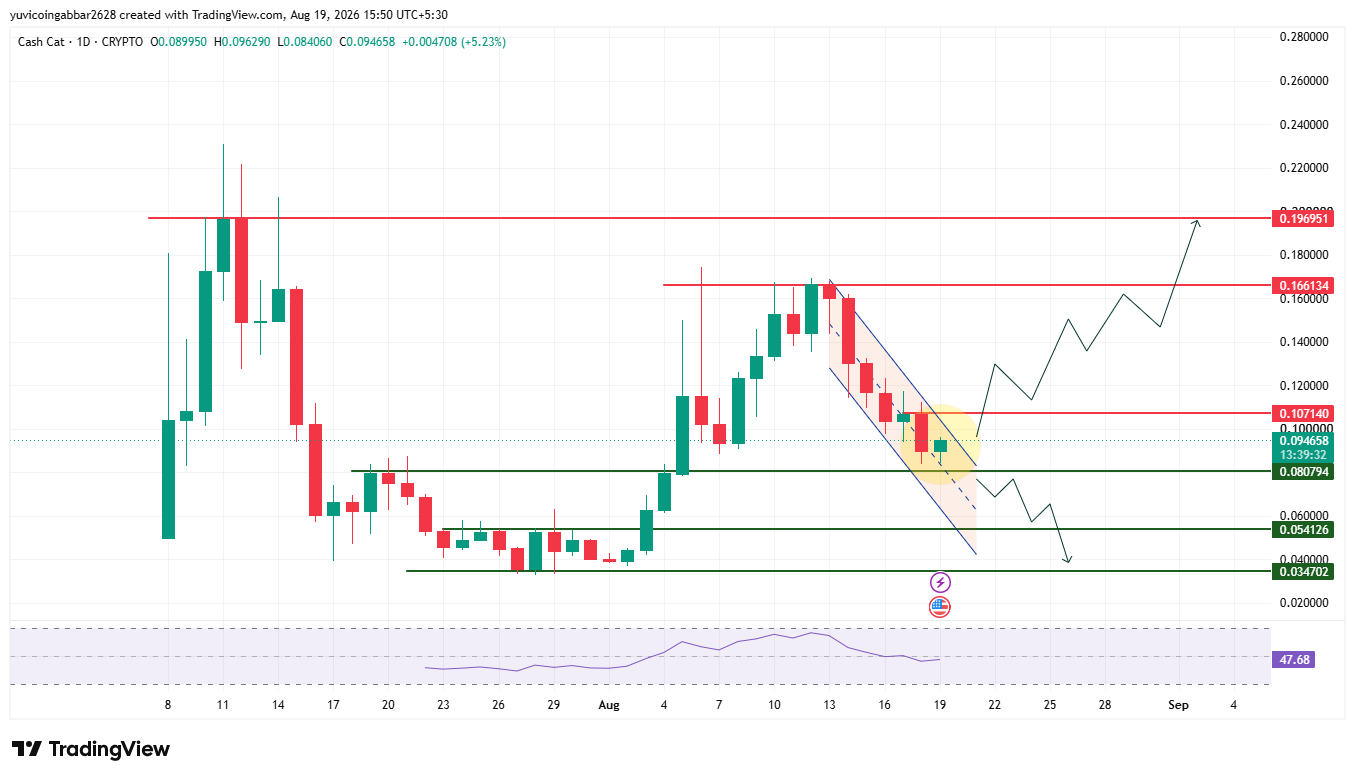
Support and Resistance Levels
Level Type | Price |
Resistance 3 | $0.196951 |
Resistance 2 | $0.166134 |
Resistance 1 (nearest) | $0.107140 |
Immediate Price Reference | $0.094658 |
First Support | $0.080794 |
Deeper Support | $0.054126 |
Structural Floor | $0.034702 |
Cash Cat Forecast: Bull Case vs. Bear Case
CASHCAT price target 2026 Bull case: Holding above $0.080794 and reclaiming $0.107140 would suggest the pullback is stabilizing.
A confirmed break above that level would open a path back toward $0.166134.
CASHCAT price target 2026 Bear case: A close below $0.080794 would risk a slide toward $0.054126, with the $0.034702 structural floor as the next stop if selling accelerates.
CASHCAT Price Scenarios: Triggers and Invalidation
Scenario | Trigger | Likely Outcome | Invalidation Point |
Support hold / bullish | Reclaim $0.107140 | Move toward $0.166134 & $0.196951 | Rejection below $0.107140 |
Range consolidation | Price stays between $0.080794 and $0.107140 | Sideways chop | Break of either boundary |
Breakdown / bearish | Close below $0.080794 | Slide toward $0.054126 & $0.034702 | Reclaim of $0.080794 |
Can CASHCAT Reach $0.196951?
$0.196951 is the highest resistance marked on the chart, above CASHCAT's own August peak.
Getting there would require reclaiming $0.107140 first, then clearing $0.166134, a multi-stage recovery, not a quick move.
What Could Invalidate the Bullish Setup?
A close below $0.080794 followed by continued selling toward $0.054126 would confirm the August rally has fully unwound.
Cash Cat Price Prediction: Expert Analysis
According to CoinGabbar analysts, CASHCAT's story so far has been a fast rally built on a short squeeze, followed by an orderly pullback rather than a panic sell-off.
The liquidation data backs that up, with far smaller and more balanced flushes since the top.
Volume ticking up in the last two sessions is worth watching, since renewed volume near support often precedes the next directional move.
The $0.080794 level is the one that matters most right now.
Disclaimer: This piece is for informational purposes only and isn't financial advice. The levels and scenarios above are based on technical chart analysis and publicly available data at the time of writing, and crypto markets can move sharply within hours, so past patterns don't guarantee future outcomes. It's worth doing independent research and considering your own risk tolerance before acting on any of the levels discussed here.
Also read:







.webp)








