Cardano Price Prediction: Can ADA Sustain This Breakout?


Cardano price prediction chatter is building again as ADA pulls off a move that traders have been waiting on for weeks, breaking free from a pattern that had capped every previous bounce.
The question now is whether this breakout has real legs or whether it fades like the attempts before it. The setup below breaks down exactly what would confirm this move, and it builds on our latest ADA price prediction coverage of this same chart.
The levels described here apply strictly to the 4-hour timeframe covered and should be rechecked if the price closes beyond the stated range.
$ADA Price Right Now
Metric | Value |
Price | $0.1849 |
24h Change | -0.64% (-$0.001192) |
Market Cap | $6.74B |
Futures Volume (24h) | $767.71M |
Spot Volume (24h) | $138.95M |
Open Interest | $500.37M |
Circulating Supply | 36.50B $ADA |
Total Supply | 44.99B $ADA |
Max Supply | 45.00B $ADA |
Open interest refers to the total value of ADA derivative contracts still open across exchanges, a rough gauge of active leveraged positioning.
Chart source: ADA/USDT 4-hour perpetual, TradingView, Binance data feed, captured August 3, 2026, around 11:31 AM IST.
Market cap, volume, and supply figures from ADA market data on CoinGlass were captured the same day.
Methodology and Data Sources
This Cardano price prediction uses the ADA/USDT 4-hour chart on Binance via TradingView for price structure, with volume, open interest, and market cap figures from CoinGlass, and liquidation flow from CoinGlass's liquidation tracker.
Readers who want the wider monthly picture beyond this single setup can also check our ADA August 2026 outlook.
All levels are treated as invalidated only on a confirmed candle close beyond the stated trigger, not an intraday wick.
Since this setup is built purely off the 4-hour timeframe, it is worth rechecking once the price closes clearly above or below the range described below.
Cardano Ecosystem Spotlight: $ADA Ranks Among Top Developed Chains
Adding some context to this Cardano price forecast, BSCNews reported on August 3, 2026, that Cardano ranks as the second most developed blockchain network after Ethereum, citing Chainspect's development dashboard.
The report states Cardano logged 43 in 30-day developer activity, ahead of Solana's 21, while Ethereum led the wider industry with 475.
Source: BSCNews developer update on X, posted August 3, 2026, checked August 3, 2026. Developer activity does not move price directly, but it adds a fundamental angle worth tracking alongside this ADA technical analysis.
Cardano Liquidation Data Today
Liquidation activity over the past hour was minimal and entirely long-side, with $4.39K wiped out and zero short liquidations in that window.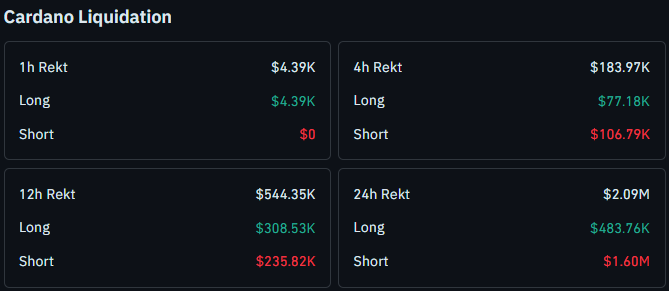
The 4-hour window shows a bigger split, with $183.97K in total liquidations, made up of $77.18K from longs and $106.79K from shorts.
Over 12 hours, total liquidations reach $544.35K, with $308.53K from longs and $235.82K from shorts.
Across the full 24 hours, liquidations hit $2.09M, and this window tells a different story. Shorts account for $1.60M of that figure while longs make up just $483.76K, a squeeze that lines up closely with the trendlinefigure, a pattern also covered in our ADA staking anniversary breakout piece.
Source: ADA liquidation data, CoinGlass, checked August 3, 2026, around 11:31 AM IST.
Key Takeaways
Price broke and closed above its prior descending trendline on the 4-hour chart after three tests.
A reclaim and hold of $0.1681 opens the door to $0.1997 and then $0.2325.
A close below $0.1534 puts $0.1380 in view as the next support.
Short liquidations dominated the 24h window, a reversal from the long-heavy shorter windows.
Fresh developer activity data adds a fundamental angle to this Cardano price prediction, separate from the chart setup.
Cardano 4-Hour Chart Analysis
On the 4-hour chart, price had been following a descending trendline for a while, with each bounce fading before it could threaten the line.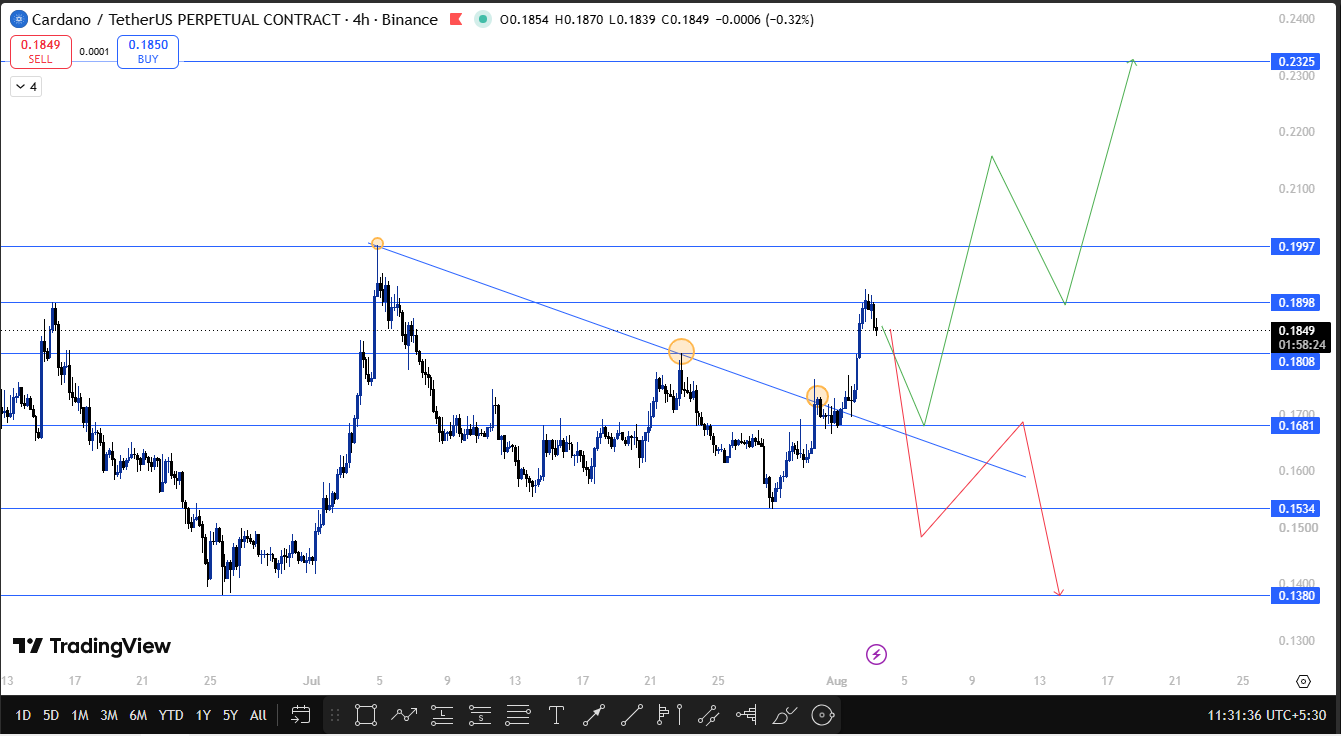
The first tap brought solid selling pressure, and price backed off quickly from there.
The second tap created a fresh lower low, extending the downtrend and testing whether buyers had any real interest at that level, a question we explored further in our ADA breakout or breakdown coverage.
At the third tap, price finally sustained itself and pushed through the trendline with a confirmed close, marking the breakout traders had been watching for.
A short pullback from here would not be unusual before the next leg plays out, a scenario also covered in our ADA breakout decision piece.
If $ADA reclaims $0.1681 and holds that level as support, the next resistance to watch is $0.1997, followed by $0.2325.
If instead $ADA breaks and closes below $0.1534, that puts $0.1380 as the next support in view.
$ADA Technical Outlook Snapshot
Indicator | Signal |
Trend | Broke and closed above the prior descending trendline after three tests |
Structure | The third tap sustained and reversed the short-term structure; a brief pullback remains possible. |
Liquidations | Short liquidations dominate the 24h window, a reversal from the long-heavy shorter windows. |
BTC Correlation | Broader market tone is likely to matter as much as this chart structure |
$ADA Support and Resistance Levels to Watch
Type | Level | Note |
Resistance 2 | $0.2325 | Extended upside target |
Resistance 1 | $0.1997 | Next hurdle after the $0.1681 reclaim |
Reclaim Trigger | $0.1681 | Must hold as support to keep the breakout intact |
Current Price | $0.1849 | Trading above the broken descending trendline |
Support 1 | $0.1534 | Key closing-basis level, breakdown trigger |
Support 2 | $0.1380 | Next support if $0.1534 fails |
These support and resistance levels are drawn from ADA's recent swing highs and lows on the 4-hour chart, not fixed indicator values, so they may shift slightly as new highs or lows form.
Risk-Reward Table
Case | Trigger | Target |
Bull Case | Reclaims and holds $0.1681 as support | Move toward $0.1997, then $0.2325. |
Bear Case | Breaks and closes below $0.1534 | Slide toward $0.1380 and lower |
Invalidation Level
This Cardano price prediction stays constructive as long as $ADA holds above $0.1534 on a closing basis.
A confirmed close below that level would confirm a breakdown and shift focus to $0.1380, with further downside possible from there.
If $ADA reclaims $0.1681 and holds it as support, that is treated as evidence the trendline breakout has real follow-through, with $0.1997 and then $0.2325 opening up as targets.
How Bitcoin Could Influence Cardano
This setup is based on ADA's own 4-hour chart, but Bitcoin still tends to set the tone for how far altcoin moves like this one can extend.
If Bitcoin holds firm or trends higher, it generally improves the odds of $ADA reclaiming $0.1681 and working toward $0.1997 and $0.2325.
A weaker Bitcoin tape raises the risk that $ADA loses the breakout structure and slides back toward $0.1534 or $0.1380.
Many traders also watch Bitcoin dominance as a rough gauge of whether capital favors majors or altcoins, though this analysis does not track dominance figures directly and treats it only as general market context.
Planned Update
This $ADA price prediction will be revisited if Cardano confirms a reclaim and hold of $0.1681 or a close below $0.1534, or if fresh liquidation, volume, or ecosystem data meaningfully changes the setup described here, a scenario also touched on in our ADA major breakout or crash piece.
The publish date will not be updated unless one of these material changes occurs.
$ADA Glossary
Descending Trendline: A downward-sloping line connecting successive lower highs, used to track resistance during a downtrend.
Reclaim: When a price moves back above a previously broken level and holds it as support rather than resistance.
Open Interest: The total value of derivative contracts, like futures, that remain open and have not yet been settled or closed.
Liquidation: What happens when a leveraged trade gets forcibly closed because the trader ran out of margin to keep it open.
Pullback: A short-term move against the prevailing trend, often seen as healthy after a breakout before the trend resumes.
CoinGabbar's Technical Analyst View
The third tap is the standout part of this $ADA chart, since the first two attempts both failed and pushed price to fresh lower lows before buyers finally held their ground.
The confirmed close above the descending trendline is what separates this attempt from the earlier failed tests.
If $ADA reclaims $0.1681 and holds it as support, a move toward $0.1997 and then $0.2325 comes into view.
A break and close below $0.1534 would point to $0.1380 and further downside as the breakdown scenario plays out.
Disclaimer
This Cardano price prediction is based on technical chart analysis and market data available at the time of writing. Cryptocurrency markets are highly volatile, and prices can change rapidly. This content is for informational purposes only and should not be considered financial advice. CoinGabbar and the analyst do not hold a position in $ADA. Always do your own research and consult a qualified financial advisor before making any investment decisions.


















