Cash Cat Price Prediction: Can CASHCAT Hold This 25% Rally Today


A brand new token tied to Robinhood's own app just ripped over 25% in a day, and the wallet data behind that move tells a story most headlines are skipping.
Something odd happened this week with a coin most people are now typing into every Cash Cat price prediction search, one that didn't even exist three weeks ago. It came out of nowhere, tied itself to one of the biggest names in retail trading, and now it's sitting near the top of every gainer's list on every screener people check before coffee. Traders are split between calling it the next fast mover and warning that a token this young, this thin, and this leveraged can turn just as fast the other way. So which read is closer to right?
Why Cash Cat Is Trending Today and What Happens After the Spike
Cash Cat doesn't need much of an introduction anymore. CASHCAT is up 25.89% in the last 24 hours, trading near $0.084, and it's landed on nearly every top meme coin gainers list tracking small-cap tokens right now.
Volume tells a slightly different story, though. 24-hour trading volume sits at $27.04M, but that's actually down 19.26% from the day before, meaning the biggest burst of buying already happened and what's left is the aftershock.
Part of this lines up with the wider run of new altcoin token launches getting attention this month. But part of it is CASHCAT-specific, tied directly to something Robinhood's own social account posted about. We'll get into both.
Where this goes next depends less on the chart pattern and more on who's still short and how thin the liquidity really is underneath this price. Keep that in mind as you read on.
KEY TAKEAWAYS
-
Direction: Short-term momentum is bullish and squeeze-driven; long-term outlook depends on whether the Robinhood-linked hype has real staying power.
-
Why it moved: A wave of short liquidations combined with renewed attention after Robinhood's official account referenced the token pushed CASHCAT out of its base.
-
Near-term range: Roughly $0.066 to $0.109 while the current channel holds.
-
Invalidation: A daily close below $0.0625 breaks the weekly support and flips the setup bearish.
Coin Overview
| Metric | Value (as of Jul 21, 2026) |
|---|---|
| Name / Ticker | Cash Cat / CASHCAT |
| Blockchain | Robinhood Chain |
| Contract Address | 0x020bfC650A365f8BB26819deAAbF3E21291018b4 |
| Price | $0.08398 (+25.89% 24h) |
| Market Cap | $83.98M |
| Fully Diluted Valuation (FDV) | $83.98M |
| 24h Volume | $27.04M (-19.26%) |
| Vol/Mkt Cap (24h) | 32.23% |
| Liquidity/Mkt Cap | 9.73% |
| Circulating Supply | 1,000,000,000 CASHCAT (fully circulating) |
| Total / Max Supply | 1,000,000,000 CASHCAT |
| Holders | 5.21K (CoinMarketCap) / 33,302 (Robinhood Chain explorer) |
| CertiK Rating | 3.6 / 5 |
| All-Time High | $0.2252 (Jul 12, 2026, -62.75% from here) |
| All-Time Low | $0.0007991 (Jul 1, 2026, +10,398.01% from here) |
Data pulled from live Cash Cat market data and the Robinhood Chain token contract. Prices move fast on a token this new, so treat anything more than a few hours old as historical.
Technical Analysis: What's Driving the Move
Quick definitions before the chart talk: RSI (Relative Strength Index) measures how overbought or oversold a token is on a 0 to 100 scale. EMA (Exponential Moving Average) is a moving average that weights recent price action more heavily than older data. Invalidation is the price level where the current pattern stops being valid.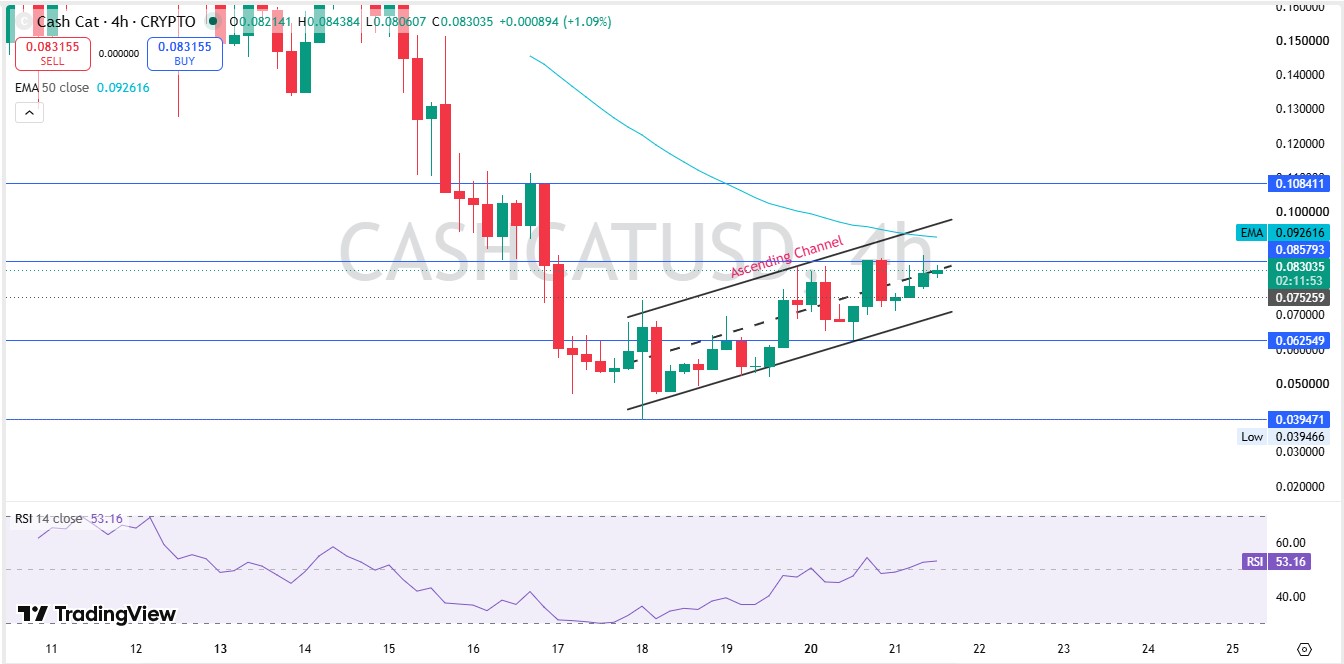
On the 4-hour CASHCAT chart, the coin crashed hard from a mid-July high, dropping from roughly $0.14 down toward $0.04 by July 17 and 18. That was a brutal stretch.
And then buyers stepped back in. Since July 18, the price has been grinding higher inside a clean ascending channel, with higher lows and higher highs, right up to today's $0.083 print.
RSI on the 4-hour reads 53.16. That's neutral. Not overbought, not oversold, just steady.
Here's the thing: the 50-period EMA sits at $0.092616, above the current price. That line has acted as resistance on the way down and will likely do the same on the way back up until price actually reclaims it.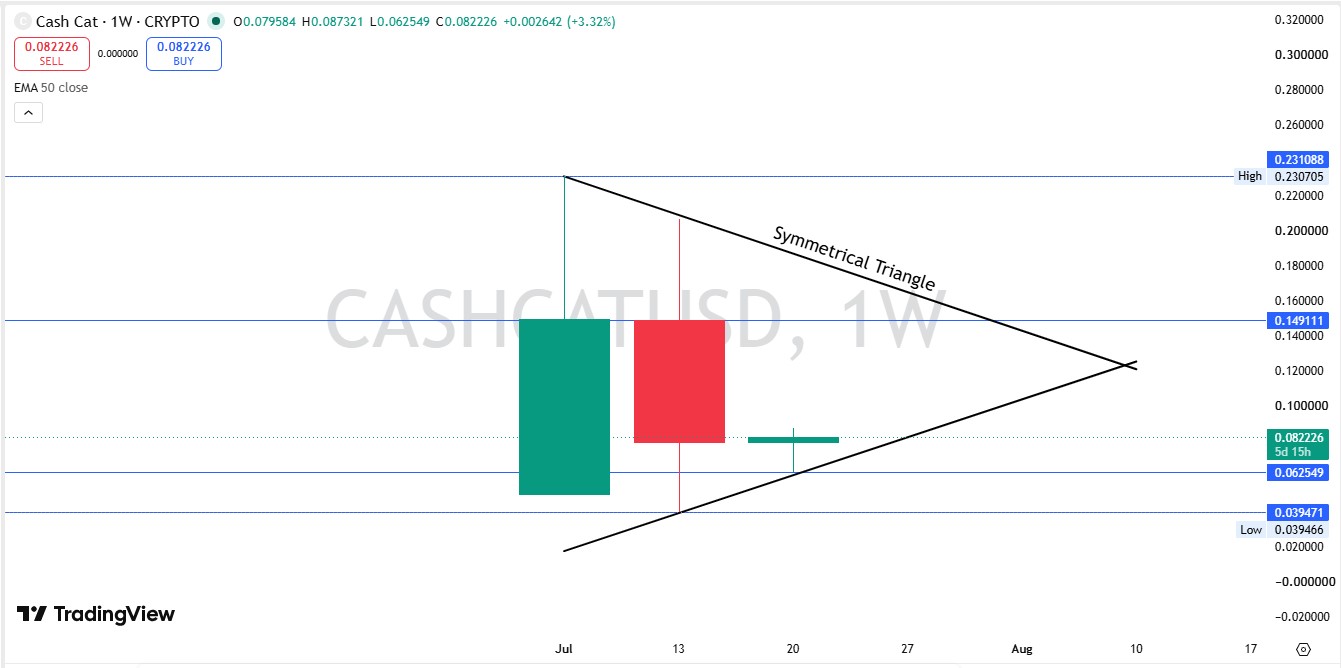
Zooming out to the weekly chart, CASHCAT is carving a symmetrical triangle, a pattern where price makes lower highs and higher lows at the same time, squeezing toward a decision point. The triangle apex lands sometime in August.
Weekly close came in at $0.082226, up 3.32% for the week. That's a smaller move than the daily chart suggests, which tells us most of this week's real fireworks happened in the last 24 hours alone.
Key levels on the current structure:
-
Immediate resistance: $0.0876 (24h high), then the 50 EMA at $0.0926, then channel resistance near $0.108
-
Immediate support: $0.0660 (24h low), then $0.0625 (weekly triangle support)
-
Weekly triangle resistance: roughly $0.109 to $0.149
-
Weekly triangle support: roughly $0.0625 to $0.0395
None of these levels guarantee anything on a token this new. They're just where reactions have happened before, the same way they do on setups like the XRP resistance rejection we covered recently.
Breaking Down the Short Squeeze
Here's where it gets interesting. We pulled the CASHCAT liquidation data, expecting a roughly balanced mix of longs and shorts getting wiped out. That is not what we found.
Over the last 24 hours, $136.99K in total positions got liquidated. Of that, $136.48K came from short positions. Long liquidations were just $506.58.
Read that again.
Shorts got run over almost entirely. Traders betting against CASHCAT got forced out as the price ripped higher, and every forced buyback to close a short position adds more upward pressure on its own. That's a short squeeze, and it's a big part of why this move happened as fast as it did.
But squeezes fade. Once the shorts are cleared out, the fuel that powered the move disappears with them.
Where the Volume Is Actually Coming From
We checked the CASHCAT futures volume heatmap next, because that tells us whether this move is organic spot buying or leverage doing the heavy lifting.
Hyperliquid alone accounts for $19.21M of futures volume on CASHCAT. Aster adds another $3.07M, with LBank and BingX, both listed among the wider crypto exchange rankings, contributing smaller amounts of around $750K each.
Turns out, almost the entire volume story here runs through derivatives. Compare that to $27.04M in total 24-hour volume across all venues, and it's clear most of the action is leveraged bets, not people buying and holding the actual token.
That matters. Leverage-driven rallies tend to move fast in both directions.
Fundamentals: The Robinhood Connection
CASHCAT runs on Robinhood Chain, the blockchain Robinhood itself launched, which is the single biggest reason this token has gotten attention beyond the usual meme coin crowd.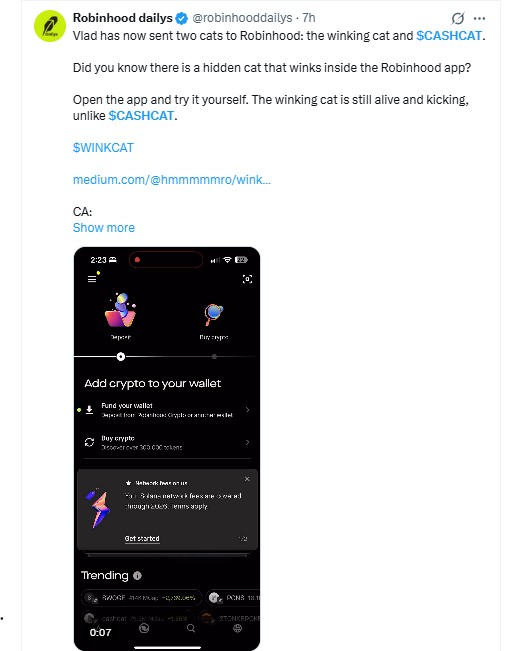
Robinhood's own "Robinhood Dailys" announcement post said Vlad, referring to Robinhood CEO Vlad Tenev, had sent two cats to the platform: a hidden winking cat easter egg tucked inside the Robinhood app itself and CASHCAT. The post directed people to open the app and find the winking cat feature, then name-dropped a related token called WINKCAT alongside it.
That's a real, verifiable tie to Robinhood's own marketing, not just a community rumor. And it explains why a token barely three weeks old is already pulling this much volume.
That's the bullish fundamental case. But it comes with a catch worth sitting with.
Now the Catch
A token launched three weeks ago, riding an app Easter egg for its main narrative, is not the same thing as a project with a product, revenue, or a roadmap, the kind of gap that shows up often across new token launches in this cycle. The attention is real. The substance behind it, so far, is thin.
CertiK's rating sits at 3.6 out of 5, which is decent for a token this young but not a clean bill of health either.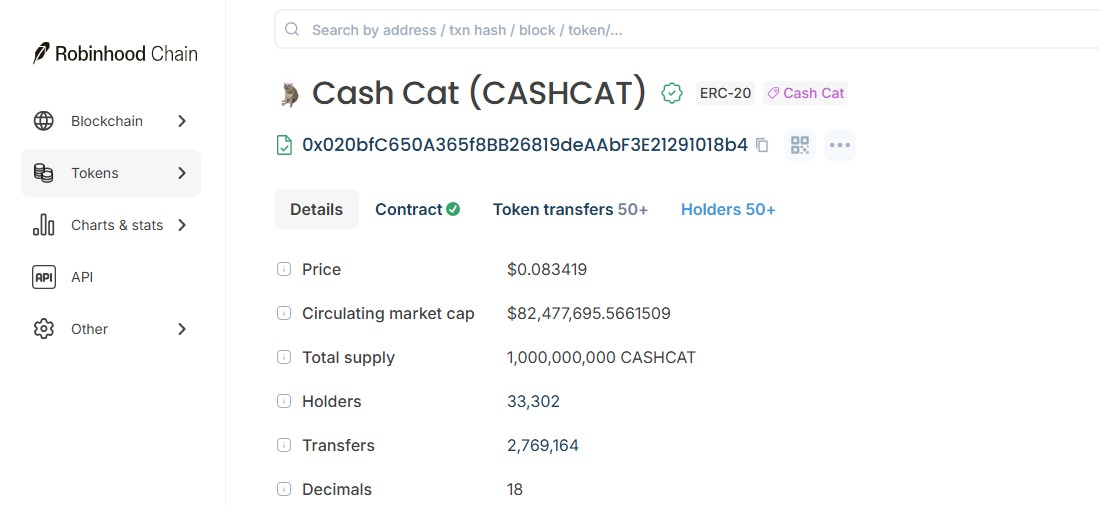
We also noticed something odd in the holder data. CoinMarketCap lists 5.21K holders. The Robinhood Chain holder data itself shows 33,302 holders and 2.77 million transfers. That's a big gap between two sources that should roughly agree, and it's worth double-checking before leaning too hard on either number.
Tokenomics and Supply Risk
Total supply and circulating supply both sit at 1 billion CASHCAT, fully out already. There's no future unlock cliff waiting to hit the market, which actually removes one of the biggest risks that hits most brand new tokens a few months after launch.
FDV and market cap are identical at $83.98M, since nothing is locked. That's a genuinely clean setup on the supply side.
Liquidity sits at 9.73% of market cap. That's thin for a token moving this much volume, and it's part of why price swings have been this sharp in both directions, even during a stretch when the broader crypto market rally has lifted risk appetite generally.
Historical Context
CASHCAT hit its all-time high of $0.2252 just nine days ago, on July 12. From there it fell 62.75% to where it sits today.
The all-time low, $0.0007991, was set on July 1, the day trading effectively began. From that low to today's price, CASHCAT is up over 10,398%.
That's the full life story of this token in three weeks: a vertical launch, a parabolic top, a brutal 60%+ drawdown, and now a recovery attempt that's still unproven. Moves like this often line up with periods when capital rotates into altcoins, which can inflate small-cap volume fast in both directions. Most of that round trip happened before this coin was even old enough to have a real trading history to lean on.
Scenarios: Bull, Base, and Bear
Using the same bull-bear base case framework applied across major assets, here's how CASHCAT's setup breaks down:
| Scenario | Conditions | Target | Timeframe | Invalidation |
|---|---|---|---|---|
| Bull Case | Robinhood-linked attention continues, shorts stay squeezed, triangle breaks upward | $0.15 to $0.23 (retest of prior highs) | 2 to 6 weeks | Daily close below $0.066 |
| Base Case | Price consolidates inside the current triangle, volume normalizes | $0.066 to $0.109 range-bound | Days to a few weeks | Break of either triangle boundary on volume |
| Bear Case | Short squeeze exhausts, Robinhood hype fades, thin liquidity gets tested | $0.0395 to $0.0625 (retest of prior lows) | Days to weeks if triggered | Recovery only if price reclaims $0.0876 and holds |
The bear case isn't a throwaway line here. With liquidity at under 10% of market cap and most of today's volume running through leveraged futures, a fade in attention could unwind this move just as fast as it built.
What Would Actually Change This Thesis
-
Bullish confirmation: A daily close above $0.0926 on rising volume, held for 48 hours.
-
Key support to watch: $0.0660 on the 4-hour and $0.0625 on the weekly.
-
Hard invalidation: A daily close below $0.0625, which breaks the weekly triangle support.
-
Narrative risk: Any sign that Robinhood distances itself from the token, or that the winking cat promotion was a one-off, could pull attention away fast. It's worth tracking the crypto events calendar for any follow-up Robinhood announcements tied to the token.
Cash Cat Long-Term Outlook: The Honest Version
Long-term is genuinely hard to call on a token that's existed for three weeks. There isn't enough price history to lean on, and the entire bull case right now rests on continued attention from Robinhood's marketing rather than any product or revenue story.
The supply setup is clean. The Robinhood tie-in is real and verifiable. The short squeeze this week was legitimate, not manufactured hype.
None of that offsets how thin the liquidity is or how young this token still is.
We're not calling this a dead cat bounce, pun aside. What we can say plainly is that CASHCAT right now is a momentum and narrative trade first, and anything resembling a long-term price target should be treated as far more speculative than the technical levels above suggest. For comparison against larger, more established assets, see our broader crypto price predictions coverage.
Disclaimer: This article is for informational purposes only and isn't financial advice. Newly launched, low-liquidity tokens carry elevated risk of sharp, sudden price moves in both directions. Verify all figures independently before making any trading decision. Data sourced from CoinMarketCap, the Robinhood Chain block explorer, and TradingView as of July 21, 2026.

















