Chainlink Price Prediction: US Govt Data On-Chain Sparks LINK Rally


Chainlink launched in 2017 as a decentralized oracle network built to feed real-world data into smart contracts, with LINK as its native token. $LINK is currently trading around $11.23 right now, up just 0.2% on the day.
Market cap works out to roughly $8.402 billion, keeping Chainlink near rank #17 among all cryptocurrencies.
The rest of this Chainlink price prediction breaks down where $LINK might go from here.
Live Market Data
Metric | Value |
Price | $11.23 |
24h Change | +0.2% |
24h Range | $10.92 – $11.27 |
Market Cap | $8.402B |
Fully Diluted Valuation | $11.231B |
24h Trading Volume | $348.378M |
Total Value Locked (TVL) | $1.735B |
Circulating Supply | 748.1M |
Total / Max Supply | 1B |
Source: LINK market cap data taken from CoinGecko, data as of Sep 03, 2026. Figures may vary slightly across other tracking websites.
Exchange Volume
Most of LINK's futures volume is concentrated on a handful of exchanges. Binance leads by a wide margin at $127.07M over 24 hours, with WhiteBIT ($35.88M) and Bybit ($34.88M) next in line.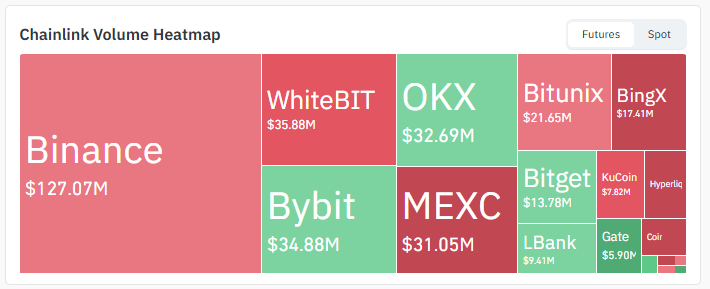
Source: Volume Heatmap Data Taken From CoinGlass, As of Sep 3, 2026
OKX adds another $32.69M, followed by MEXC at $31.05M. Bitunix, BingX, Bitget, KuCoin, LBank, Gate, and Hyperliquid fill out the rest, each somewhere between $5M and $22M.
Liquidity is holding up well enough across the board for the current price range to stay orderly.
Liquidation Snapshot
The last 12 hours tell a clear story of shorts getting caught out.
Total liquidations over that window hit $202.48K, and short positions made up $168.13K of that against just $34.35K on the long side. That kind of imbalance usually lines up with a sharp move higher that squeezed short sellers.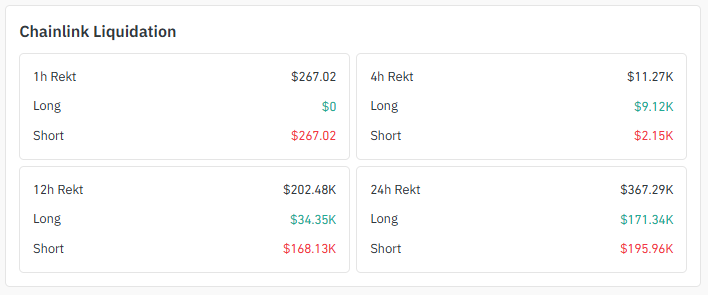
Source: Liquidation Data Taken From CoinGlass, As of Sep 3, 2026
Zoom into the most recent 4-hour window, though, and the pattern flips: $9.12K in longs got wiped out versus only $2.15K in shorts, pointing to a short-term pullback. Over the full 24 hours, shorts still edge out longs, $195.96K to $171.34K.
Put together, it looks like a sharp pump followed by a cooldown, which lines up with what the chart itself is showing.
Technical Analysis for $LINK
Descending Channel Structure
Zoom in on the 4-hour chart, and $LINK has been sliding lower inside a fairly clean descending channel for the past several sessions, right after a sharp, almost vertical move up. 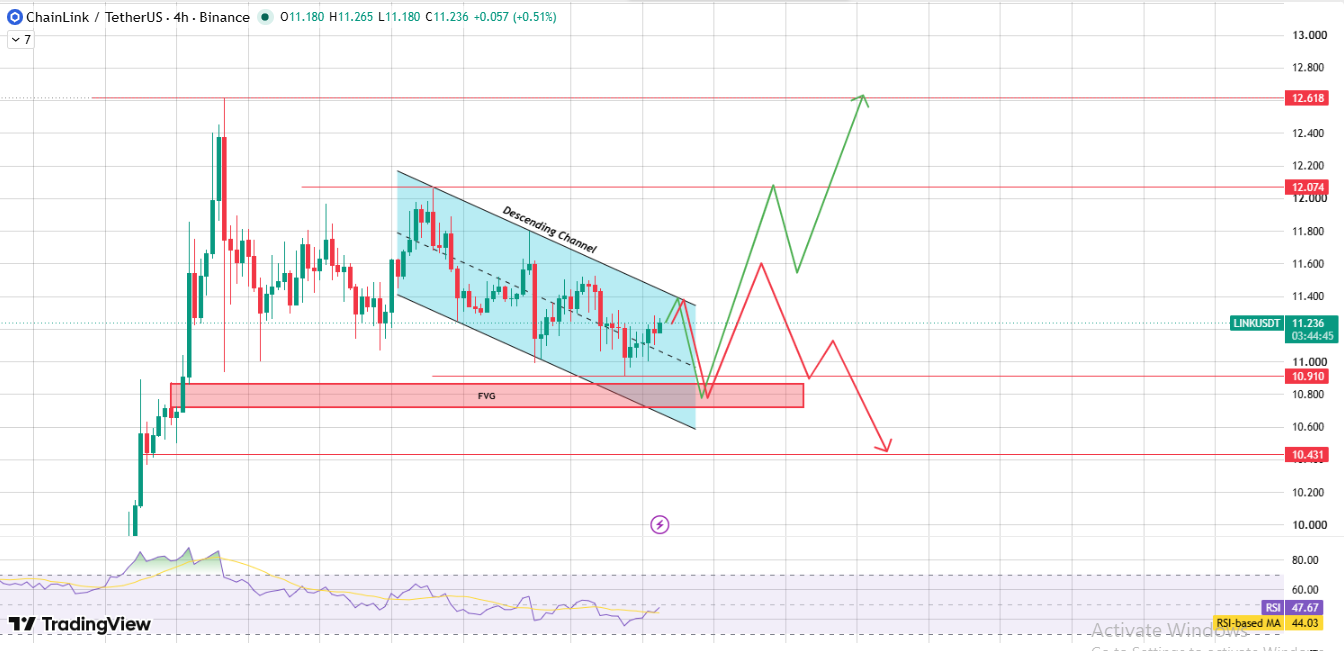
Source: Chart Taken From TradingView, As of Sep 3, 2026
Sellers have kept a lid on every bounce along the upper trendline of that channel.
Price is now pushing back up toward that upper boundary, close to the $12.074 area, which is also where the channel resistance and a key horizontal level line up.
Fair Value Gap and Momentum
Below the current price sits an unfilled fair value gap, roughly between $10.80 and $10.91. It formed during that earlier sharp rally, when the price moved so fast it left a gap in trading activity behind it.
Gaps like this tend to get revisited before a trend resumes.
RSI is at 47.67, sitting just above its own moving average of 44.03. That's a neutral reading; momentum isn't strongly bullish or bearish right now, which fits with the price sitting mid-channel, still deciding on a direction.
Breakout and Rejection Scenarios
Here's the setup for a genuine breakout: price rejects at the channel's upper boundary near $12.074, drops back down to fill the FVG between $10.80 and $10.91, and finds buyers there.
A bounce off that zone followed by a break above the channel would open the door to $12.074 first, then $12.618, in this LINK price prediction.
The other side looks different. If the FVG support gives way instead of holding and the price closes below the channel’s lower boundary, the bearish move could gain momentum.
The descending structure would be confirmed as the dominant trend, with $10.431 as the next level where buyers would need to step back in.
Support and Resistance Levels (4H Chart)
Level Type | Price |
Resistance 2 | $12.618 |
Resistance 1 | $12.074 |
FVG Support Zone | $10.80 – $10.91 |
Support 1 | $10.431 |
Levels reference the 4-hour candle close on the LINK/USDT chart, Binance, UTC.
Bull, Base, and Bear Case for $LINK
Scenario | Trigger | Price Targets |
Bull Case | Price dips to fill the FVG between $10.80 and $10.91, finds support there, and then breaks above the descending channel's upper boundary. | $12.074, then $12.618 |
Base Case | LINK continues to oscillate inside the descending channel, holding between the FVG zone and channel resistance. | Range-bound between $10.80–$10.91 and $12.074 |
Bear Case | FVG support fails to hold, and the price closes below the channel's descending lower boundary. | $10.431 |
Chainlink News
The U.S. Department of Commerce has started bringing official economic data, including GDP and PCE figures, on-chain through Chainlink, live across 10 different blockchains.
That means blockchain applications can now access real government economic data as soon as it's released, instead of relying on delayed, centralized sources.
Analyst Michaël van de Poppe called it massive news for $LINK.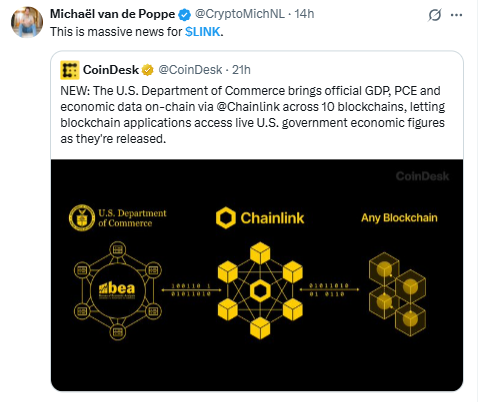
Source: Data Taken From @CryptoMichNL, X Account, As of Sep 03, 2026
Worth noting: this kind of real-world integration is a fundamental tailwind rather than a short-term price trigger.
It strengthens the long-term case for Chainlink's oracle network, but near-term price action will likely still be driven by the technical levels on the chart.
Market Pulse
Put the pieces together: a flat day on the surface, a heavy short squeeze in the prior 12 hours, and a smaller long liquidation in the most recent 4 hours.
It looks like the market ran hot on the way up and is now cooling into a decision zone.
Volume is still concentrated on the larger exchanges, RSI has room in both directions before it gets stretched, and traders are watching the same two zones: the FVG support below and channel resistance above.
Glossary
Descending Channel: Two downward-sloping trendlines running roughly parallel, with price bouncing between them.
Traders watch the lower line as support and the upper line as resistance to break through.
Fair Value Gap (FVG): A price zone that gets skipped over during a fast, sharp move, leaving an imbalance between buyers and sellers. Price often returns to these zones later before continuing its trend.
RSI: Short for Relative Strength Index, it's a 0–100 oscillator built to measure how fast and how far price has moved recently, and it's most useful for spotting when a move has gotten overextended.
Getting liquidated means a leveraged futures position gets force-closed because there isn't enough margin left to cover the loss.
When liquidations pile up heavily on one side, the resulting scramble to close out can push the price further in that same direction.
TVL (Total Value Locked): The total value of assets secured or flowing through a protocol's smart contracts in Chainlink's case, the value relying on its oracle data feeds.
Disclaimer: This Chainlink price prediction draws on technical chart analysis and publicly available market data, and it isn't financial advice. LINK is volatile, and the price could fall well below the support levels covered here if broader market conditions sour. Past patterns and indicator signals don't guarantee what happens next, and actual price action may look nothing like the scenarios above. Do your own research and weigh your own risk tolerance before acting on any of this.
Also read:
















