Chainlink Price Prediction: LINK Eyes $15 After ETF Inflows Surge


This Chainlink price prediction lands right after a tense hour for LINK bulls.
Buyers pushed hard to clear the descending trendline that has been capping the price, got close, and then got turned away.
The coin is now back trading beneath that same line, and the next hour or two could decide whether this was a shakeout or the start of something rougher.
The levels below come from a 1h chart and reflect a short-term technical view, not a guaranteed outcome.
Chainlink Price Right Now: Live Data and Key Levels
Metric | Value |
CMP (Current Market Price) | $11.359 |
24-Hour Change | -1% |
Market Cap | $8.50 billion |
Futures Volume (24h) | $818.22 million |
Spot Volume (24h) | $151.74 million |
Open Interest | $654.72 million |
Circulating Supply | 748.09 million LINK |
Total Supply | 1.00 billion LINK |
Max Supply | 1.00 billion LINK |
Futures volume of $818.22 million against spot volume of $151.74 million works out to roughly 5.4 times more futures activity than spot, an independently calculated ratio confirming leveraged traders are steering this move.
Open interest of $654.72 million against an $8.50 billion market cap puts leverage exposure near 7.7% of market cap, down slightly from the prior session, suggesting some positions closed out around the failed breakout.
Source: CoinGlass live market data, August 24, 2026, 09:26 IST. Chart source: TradingView, LINK/USDT Perpetual, Bybit, 1-hour timeframe.
Methodology Behind This Chainlink Price Prediction Today
This Chainlink price outlook is built on the 1-hour LINK/USDT perpetual chart on Bybit, viewed through TradingView.
CMP is taken from the live price marked on that chart, and target and support levels are pulled directly from recent swing highs and lows marked on the same chart, with one exception noted below.
Chainlink ETF Inflows Keep Building Even as Price Stalls
There is a notable gap opening up between the chart and the flow data behind this LINK price prediction.
According to BSCN, spot Chainlink ETFs have now stretched their net inflow run to six straight days, and this week's net inflow has reached $13.35 million, the strongest single week the products have logged since their first month after launch.
That kind of accumulation typically does not reverse on a single failed hourly breakout.
It points to buyers with a longer time horizon adding LINK even while short-term traders get whipsawed on the chart, and it is worth weighing against the rejection described below.
Source: BSCN on X, August 23, 2026, 11:32 PM.
LINK Liquidation Data Today
The liquidation data tells a story that has flipped in the last few hours.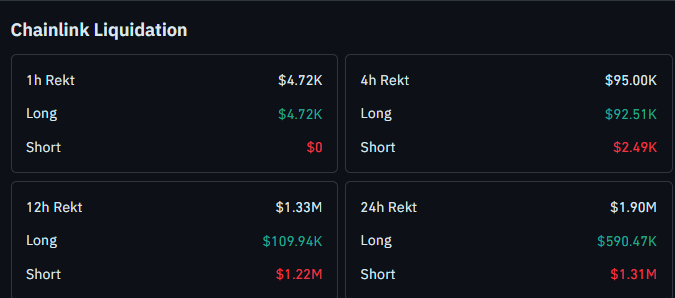
In the past hour, long-side liquidations came to $4.72K against $0 on the short side, and the 4-hour window shows $92.51K in long-side liquidations against just $2.49K short-side.
That is why it has been getting caught out, as the price failed to hold above the trendline.
Zoom out to the 12-hour and 24-hour windows, and the picture still leans the other way.
The 12-hour window shows $1.22M in short-side liquidations against $109.94K long, and the 24-hour window shows $1.31M short-side against $590.47K long.
Earlier in the session, short sellers were the ones getting squeezed.
The recent hours have reversed that, with longs now absorbing the pain as the breakout attempt failed.
Source: CoinGlass liquidation data, August 24, 2026, 09:26 IST.
LINK Trend and Momentum: Key Takeaways for Traders
LINK attempted a breakout above its 1-hour descending trendline and failed, and the price is back trading below that structure
CMP is trading near $11.359, down about 1% on the day per CoinGlass
A break and 1-hour close above $11.737 opens the path toward $12.627, then the psychological $15 level if momentum builds
A break and 1-hour close below $11.033 would shift the near-term bias bearish, with $10.752 as the next support
Spot Chainlink ETFs have stretched their inflow streak to six days with $13.35 million added this week, the biggest weekly haul since launch
Long-side liquidations have picked up sharply in the last 1 to 4 hours, a reversal from the short-side dominance seen over the full day
These levels reflect a short-term, 1-hour setup. A failed breakout can resolve either way within a few candles, so treat these as levels to watch rather than certainties.
Chainlink Price Prediction: 1-Hour Chart Breakout Analysis
LINK tried to push through the descending trendline that has been capping it and could not hold above it.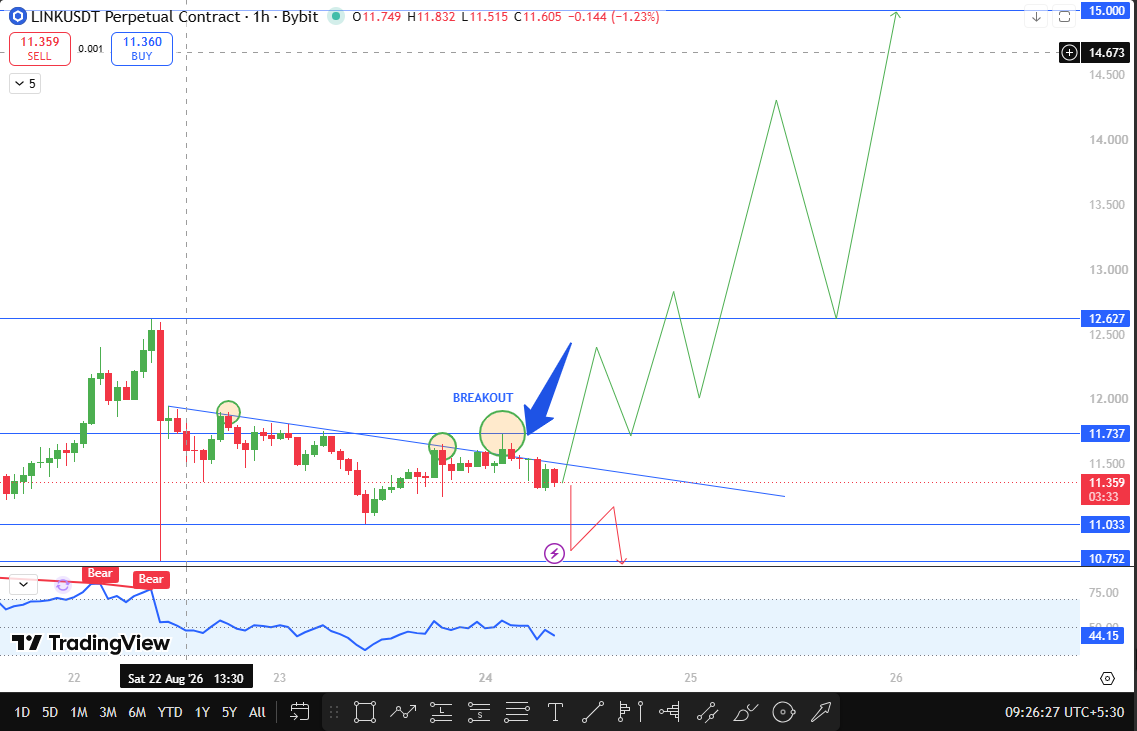
The chart shows buyers stepping in near the line, testing it, and getting sold back into range, with the price now trading beneath that trendline again.
The built-in momentum panel on the chart flagged the move with back-to-back Bear tags as the rejection played out, and the oscillator reading has slipped to around 44.15, sitting below the midpoint and reinforcing that momentum has cooled rather than accelerated.
If LINK breaks and closes on the 1-hour above $11.737, that reclaims the trendline zone and opens the door toward $12.627, an old swing high.
A sustained push beyond that brings the $15 mark into view, a round psychological number rather than a chart-derived level, and one that would likely need continued ETF buying alongside a broader market lift to reach.
On the downside, a break and 1-hour close below $11.033 would confirm the rejection has real weight behind it.
That level is a recent swing low, and losing it opens room toward $10.752, the next swing low below it.
Technical Outlook Snapshot for This Chainlink Price Prediction
Indicator | Signal |
Chart Pattern | 1h descending trendline, failed breakout, price back below the line |
Momentum Panel (TradingView, 1H) | Near 44.15, Bear tags active during the rejection |
Near-Term Bias | Neutral to bearish below $11.737, only a 1-hour close above it shifts this bullish |
LINK Support and Resistance Levels Worth Watching Now
Level Type | Price | % From CMP | Note |
Extended Target | $15.00 | +32.06% | Psychological level, not a chart-derived swing point |
Major Resistance 2 | $12.627 | +11.16% | Recent swing high |
Resistance 1 (trigger) | $11.737 | +3.33% | Recent swing high, trendline reclaim level |
Current Price | $11.359 | 0% | Live CMP, Bybit perpetual, 1H chart |
Support 1 (trigger) | $11.033 | -2.87% | Recent swing low, rejection confirmation level |
Support 2 | $10.752 | -5.34% | Next, a recent swing low |
LINK Risk-Reward Table for the Trendline Rejection Setup
Case | Trigger | Target |
Bull Case | Sustained 1-hour close above $11.737 | $12.627, then $15 on continued strength |
Bear Case | Break and 1-hour close below $11.033 | $10.752 |
Setup invalidation | Repeated failure to hold above $11.033 without a bounce | Bearish structure confirmed; next levels below $10.752 not yet marked. |
Invalidation Level for This Chainlink Price Forecast
This Chainlink price forecast turns cautious below $11.033.
A break and 1-hour close under that level would confirm the trendline rejection was more than a quick shakeout, shifting the near-term focus toward $10.752.
How Bitcoin Sentiment Could Move This LINK Price Outlook
LINK continues to take cues from the broader tone Bitcoin sets. A steady or rising Bitcoin could help LINK reclaim $11.737 faster, while renewed Bitcoin weakness could accelerate a slide toward $11.033 and beyond.
This Chainlink price prediction is built on LINK's own chart structure, but Bitcoin remains a factor worth tracking alongside it.
Planned Update for This Chainlink Price Prediction
This LINK price prediction will be revisited if the price closes decisively above $11.737 or below $11.033, or if fresh ETF flow or liquidation data meaningfully shifts the current setup.
Glossary of Terms Used in This LINK Technical Analysis
CMP: Current Market Price, the live traded price at the time of analysis
Open Interest: The total value of outstanding, not yet settled derivative contracts for an asset
Long-Side Liquidation: A forced closure of leveraged buy positions, typically triggered when price falls
Short-Side Liquidation: A forced closure of leveraged sell positions, typically triggered when price rises
Descending Trendline: A downward-sloping line connecting successive lower highs, acting as resistance until broken
Net Inflow Streak: A run of consecutive days where more money enters a fund than leaves it
CoinGabbar Technical Analyst View on LINK Price Action
Bull Case: A sustained 1h close above $11.737 puts the failed breakout behind LINK and opens a path toward $12.627, with $15 in view if the ETF inflow streak keeps pulling in fresh capital.
Base Case: LINK chops between $11.033 and $11.737 for the next few hours as the market digests the rejection, with liquidations flipping between longs and shorts depending on which side price tests.
Bear Case: A break and 1h close below $11.033 opens room toward $10.752, though the six-day ETF inflow streak suggests any dip could attract fresh buying rather than turning into a deeper breakdown.
Disclaimer
This article is for informational purposes only and should not be treated as financial advice. Cryptocurrency markets are highly volatile, and readers should do their own research before making any investment decisions. CoinGabbar and the analyst do not hold a position at the time of publication.












.webp)




