Chainlink Price Prediction: Oracle Milestone Fuels LINK Breakout


Chainlink price prediction traders are watching a slow squeeze play out right now.
LINK has been trading right around the support of a descending triangle for days, with the range tightening as the pattern nears its apex.
Fresh oracle data just dropped showing the scale Chainlink is now operating at, adding real weight behind the technical setup.
Whichever way this pattern resolves, the move that follows could be significant. Here is the full breakdown.
Chainlink Price Today: Live Data and 24-Hour Change
LINK is trading at $11.226 at the time of writing, down $0.1652, or 1.45 percent, over the past 24 hours.
Futures volume over the same period stands at $487.35 million, while spot volume sits at $77.77 million.
Market cap is holding at $8.41 billion, open interest is at $614.45 million, and circulating supply is 748.09 million LINK against a total supply of 1.00 billion, which also marks the max supply for this Chainlink price forecast.
Source: CoinGlass, August 31, 2026.
Chainlink Latest News and Market Catalyst
Chainlink oracles have now powered $33.6 trillion in cumulative transaction value, a figure that underlines just how deeply the network has embedded itself in on-chain infrastructure.
Alongside that, Chainlink oracles currently secure $49.55 billion in onchain LINK value, reinforcing the utility case behind this Chainlink price outlook well beyond short-term chart moves.
Milestones like this tend to strengthen the long-term fundamental backdrop even when price action stays range-bound in the near term.
Source: crypto.news on X, August 31, 2026.
Quick Take
-
CMP: $11.216 on the 4-hour Binance perpetual chart
-
Bullish trigger: 4-hour close above $12.051 confirms the descending triangle breakout
-
Bullish continuation level: $12.644, then directly $15.428
-
Bearish trigger: 4-hour close below $10.903
-
Bearish target on breakdown: $10.041
-
Data timestamp: August 31, 2026, 13:54 UTC+5:30
-
Risk note: $LINK is trading right at pattern support with the pattern narrowing, so a clean close is needed on either side before the breakout or breakdown should be trusted
Chainlink Technical Analysis
The 4-hour LINK/USDT perpetual chart on Binance shows price trading around the support of a descending triangle, with a falling upper trendline compressing against a flat horizontal support zone near $10.903.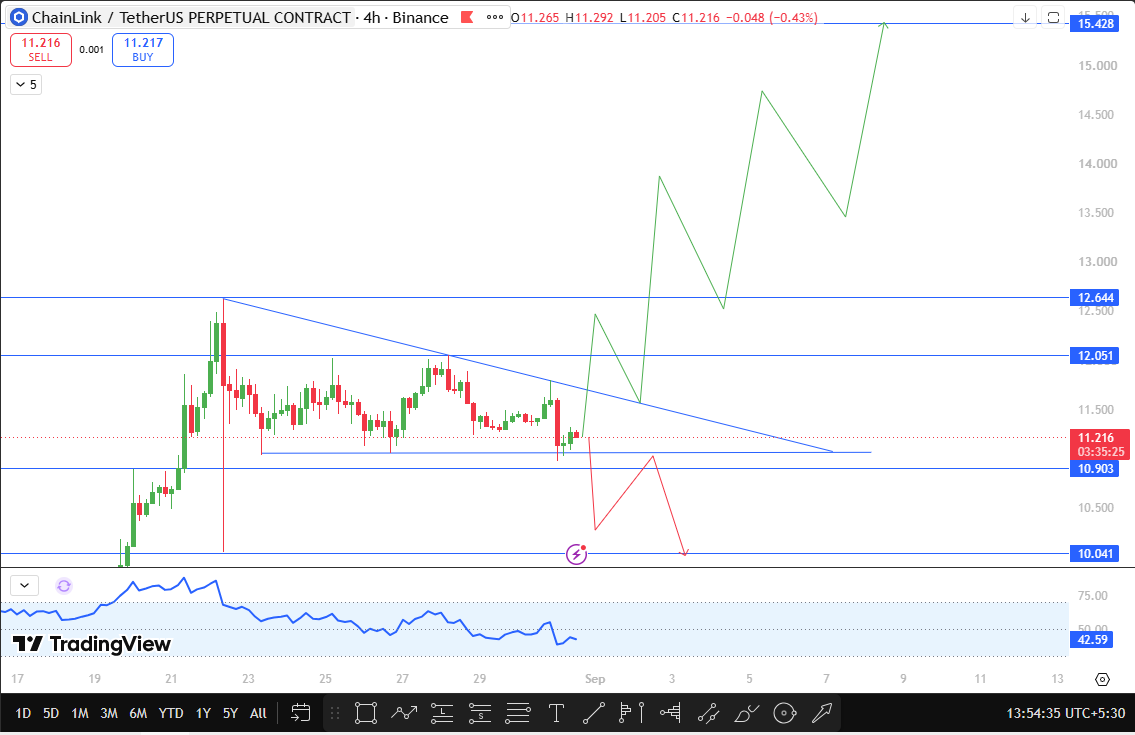
This kind of tightening structure typically builds pressure toward a sharper move once price finally breaks out of either boundary, and LINK is currently sitting close to that decision point in this Chainlink technical analysis.
If LINK breaks and closes above $12.051 on the 4-hour chart, that confirms the triangle breakout, with the next resistance at $12.644, followed by a jump directly toward $15.428 as the extended target for this LINK price prediction.
On the downside, if $LINK breaks and closes below $10.903, the next support to watch is $10.041.
The momentum reading on the chart is currently sitting near the 42.59 mark, sitting close to neutral, which fits a market still waiting for a decisive trigger rather than one already leaning hard in either direction.
Source: TradingView, LINK/TetherUS Perpetual, 4-hour chart, Binance, August 31, 2026, 13:54 UTC+5:30.
LINK Support and Resistance Levels
| Level Type | Price | Note |
| Resistance 2 | $15.428 | Extended target on confirmed breakout |
| Resistance 1 | $12.644 | Mid-breakout target |
| Triangle Resistance | $12.051 | Breakout confirmation level |
| Current Price | $11.216 | CMP on 4-hour chart |
| Support 1 | $10.903 | Pattern breakdown trigger |
| Support 2 | $10.041 | Deeper support level |
Bull, Base, and Bear Case for LINK
In the bull case, LINK price triangle support, builds momentum, and closes above $12.051 with real conviction, opening a path toward $12.644 and then directly toward $15.428.
The base case has price continuing to compress inside the triangle between $10.903 and $12.051 as the pattern nears its apex without a confirmed break on either side.
In the bear case, Price closes below $10.903, confirming the triangle breakdown, and price works its way toward a retest of $10.041.
Risks to This Chainlink Price Prediction
The biggest risk here is a false move out of the triangle, since compressing patterns like this can produce a quick wick beyond either boundary before reversing back inside the range.
Broader Bitcoin price action, shifts in overall crypto risk sentiment, and general altcoin weakness could all pull LINK away from this chart structure regardless of how the triangle resolves on its own.
This analysis is based purely on current chart structure and available data, and conditions can change quickly.
Glossary
CMP: Current Market Price, the price at which an asset is trading right now.
Descending Triangle: A chart pattern formed by a falling upper trendline and a flat horizontal support level, often resolving with a sharp move once price breaks either boundary.
Open Interest: The total number of outstanding derivative contracts that have not been settled.
Onchain Value Secured: The total value of assets an oracle network protects through its price feeds and data services.
Disclaimer
This article is for informational purposes only and should not be considered financial advice. Cryptocurrency markets are highly volatile, and readers should conduct their own research before making any investment decisions.
















