Checkmate Price Prediction $CHECK : Bithumb Listing Sparks a Rally


A chess platform just gave crypto traders something to argue about. A token most people had never heard of a week ago is suddenly the top search on half the trading Discords, joining a growing list of web3 gaming tokens catching sudden attention, and the reason traces back to one exchange decision made on the other side of the world.
Is this the start of something bigger, or just a flash of attention that fades by the weekend? That's exactly the question behind this Checkmate price prediction, and for readers tracking the wider market, our ongoing price prediction coverage has more setups like this one.
What Is Fueling the Checkmate CHECK Rally, and How Far Could It Run?
CHECK is trading near $0.048, up roughly 68% in 24 hours after Bithumb added a CHECK/KRW market. The immediate move pushed price into the $0.038 to $0.068 resistance band on the 4-hour chart. Nearest support sits at $0.0389, then $0.0299. A weekly close back under $0.026 would flip the setup bearish. Base case: momentum stays with the bulls short term, but a cooldown looks likely before any real push toward $0.08 to $0.10, a pattern similar to the bull-bear base case framework we use across majors.
Checkmate price prediction searches picked up fast once traders noticed the chart tearing off the bottom of its range. And it's not hard to see why. A token tied to a chess platform, backed by names like Animoca Brands, doesn't usually move 68% in a day.
Here's the thing: this wasn't a random pump. There was a real trigger behind it.
But before the charts, a question worth sitting with. When a small-cap gaming token gets exchange validation overnight, does the rally reflect real demand, or does it just reflect fresh eyes finding a ticker for the first time?
That question matters more than it sounds. It shapes whether this move has legs once the headlines stop trending.
Breaking: What Actually Happened
Bithumb listed CHECK against the Korean won today. The exchange listing news fits a pattern that's played out repeatedly this year for small-cap tokens gaining sudden liquidity.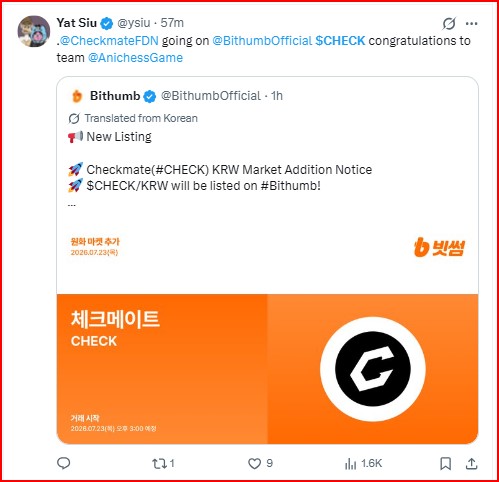
The announcement came from Animoca Brands co-founder Yat Siu, who confirmed the listing directly, tagging the Checkmate Foundation and Anichess team in his post.
Price reacted within hours. Volume followed.
CoinMarketCap data shows 24-hour trading volume near $7.35 million, up over 31%. That's a real spike, not a quiet drift higher.
Turns out, a fresh exchange listing on a top-tier venue is still one of the most reliable short-term catalysts in this market. Old playbook. Still works.
CHECK Coin Overview
| Metric | Value |
|---|---|
| Current Price | $0.048 |
| 24h Change | +68.78% |
| 24h High / Low | $0.06043 / $0.02724 |
| Market Cap | $14.68M |
| Fully Diluted Valuation (FDV) | $48M |
| 24h Trading Volume | $7.35M (+31.33%) |
| Vol/Mkt Cap (24h) | 47.02% |
| Liquidity/Mkt Cap | 4.24% |
| Circulating Supply | 305.98M CHECK |
| Total / Max Supply | 1,000,000,000 CHECK |
| Holders | 171 (on-chain) |
| Top 5 Wallet Concentration | 90.87% |
| Gini Distribution Score | 0.971 |
| All-Time High | $0.1079 (Feb 18, 2026) |
| All-Time Low | $0.005458 (Dec 4, 2025) |
| Contract Address | 0x9126236476efba9ad8ab77855c60eb5bf37586eb |
Turns out, that table tells its own story before you even get to the chart. Figures come from CoinMarketCap's live market data at the time of writing. A near-$50 million fully diluted valuation sitting on top of a $14.68 million market cap is a gap worth remembering later.
Why CHECK Is Moving: The Real Story Behind the Chart
CHECK is the token behind Anichess, a chess-focused web3 gaming project. Weeks before this listing, Anichess put Magnus Carlsen on stage in Hong Kong for an exhibition tied to the FIDE World Team Championships, an event worth tracking alongside any upcoming crypto events calendar. Chess.com, an AI opponent from Chessnutech, and backing from Animoca Brands chairman Yat Siu were all part of that event.
So the Bithumb listing didn't land on an unknown project. It landed on a token that already had a story building: a real-world event, a recognizable name in Carlsen and a network of partners behind it. That combination is very different from a pure listing-driven token rally with no underlying narrative.
That context matters for the price move. A listing alone gets you a spike. A listing plus an active community plus ongoing tournaments tends to get you something with slightly more staying power than most altcoin market movements built on hype alone. Not guaranteed. Just more likely.
Weekly Chart: The Bigger Structural Picture
The weekly TradingView chart tells a clean story. CHECK spent months inside a descending channel, dropping from its all-time high near $0.1079 down toward the $0.015 to $0.017 support zone. That's the pattern where lower highs and lower lows form a downward-sloping tunnel, and the price had been stuck inside it since February.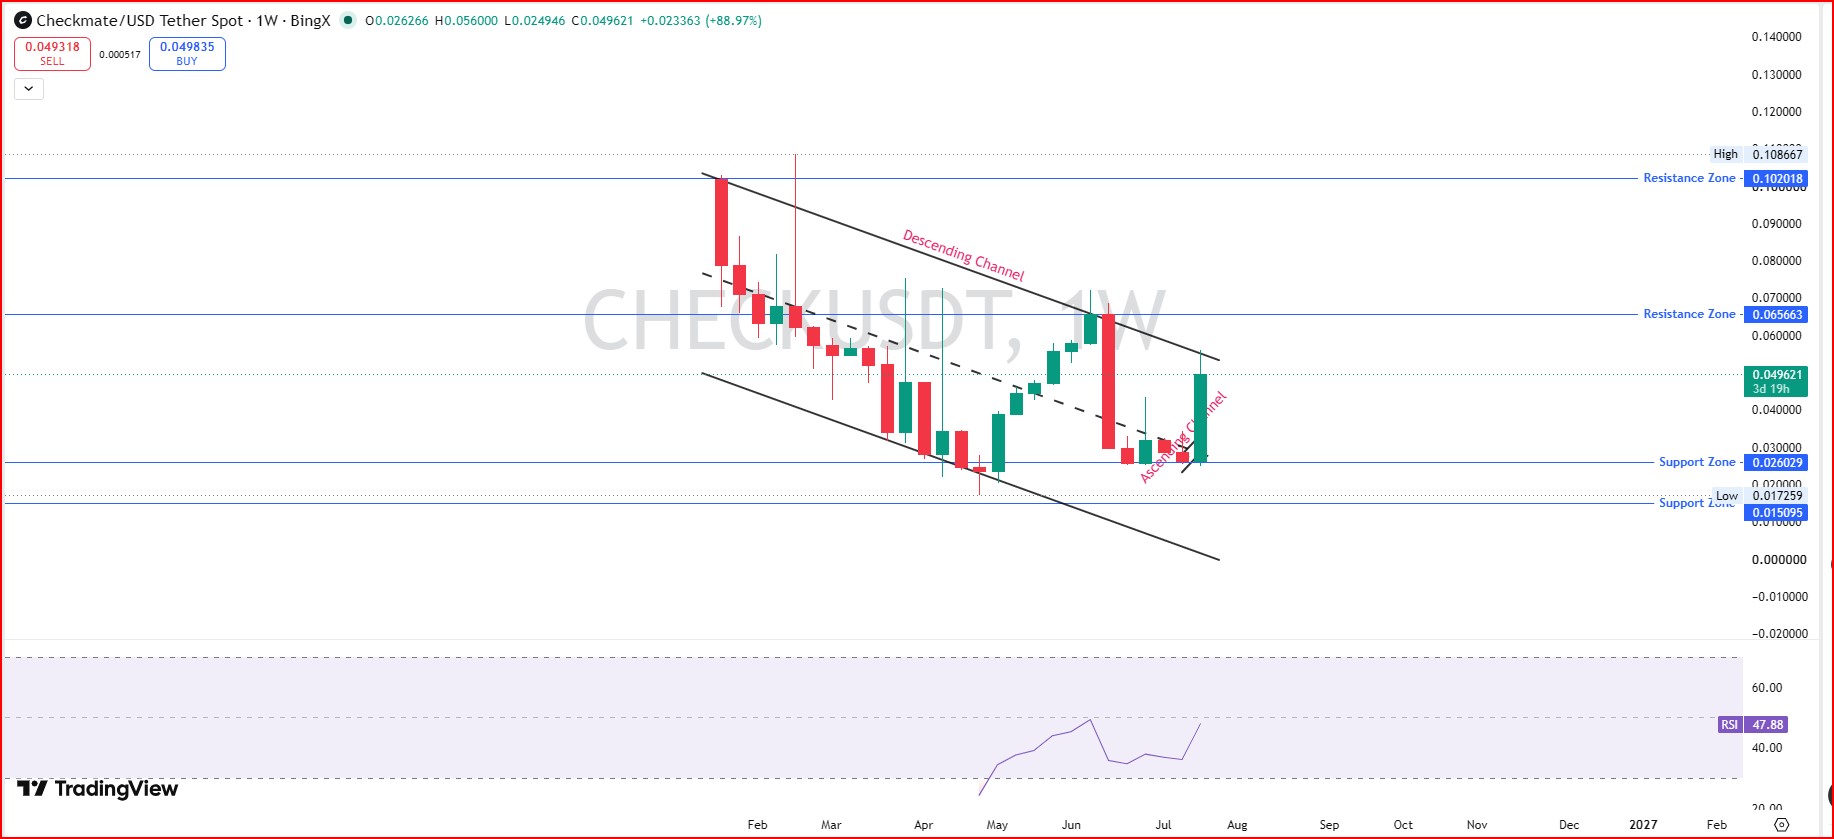
Then price broke out.
The last few weekly candles show CHECK climbing out of that descending channel into a new ascending channel, the mirror-opposite structure where higher lows start forming. This kind of structural shift often shows up right as broader market sentiment turns risk-on again.
Weekly RSI, or relative strength index, a momentum gauge on a scale of 0 to 100 that flags overbought or oversold conditions, sits at 47.88. Readings near 50 mean there's no extreme in either direction yet. That's actually bullish context here. It means this rally hasn't exhausted itself on the higher timeframe.
Whales noticed first. Weekly volume tells that part.
4-Hour Chart: Where the Action Is Right Now
Zoom into the 4-hour chart, and the picture gets more urgent. CHECK broke out of a tight ascending channel with one large green candle, spiking from around $0.030 to a high of $0.056 before pulling back to $0.0497, down 9.37% from that intraday peak.
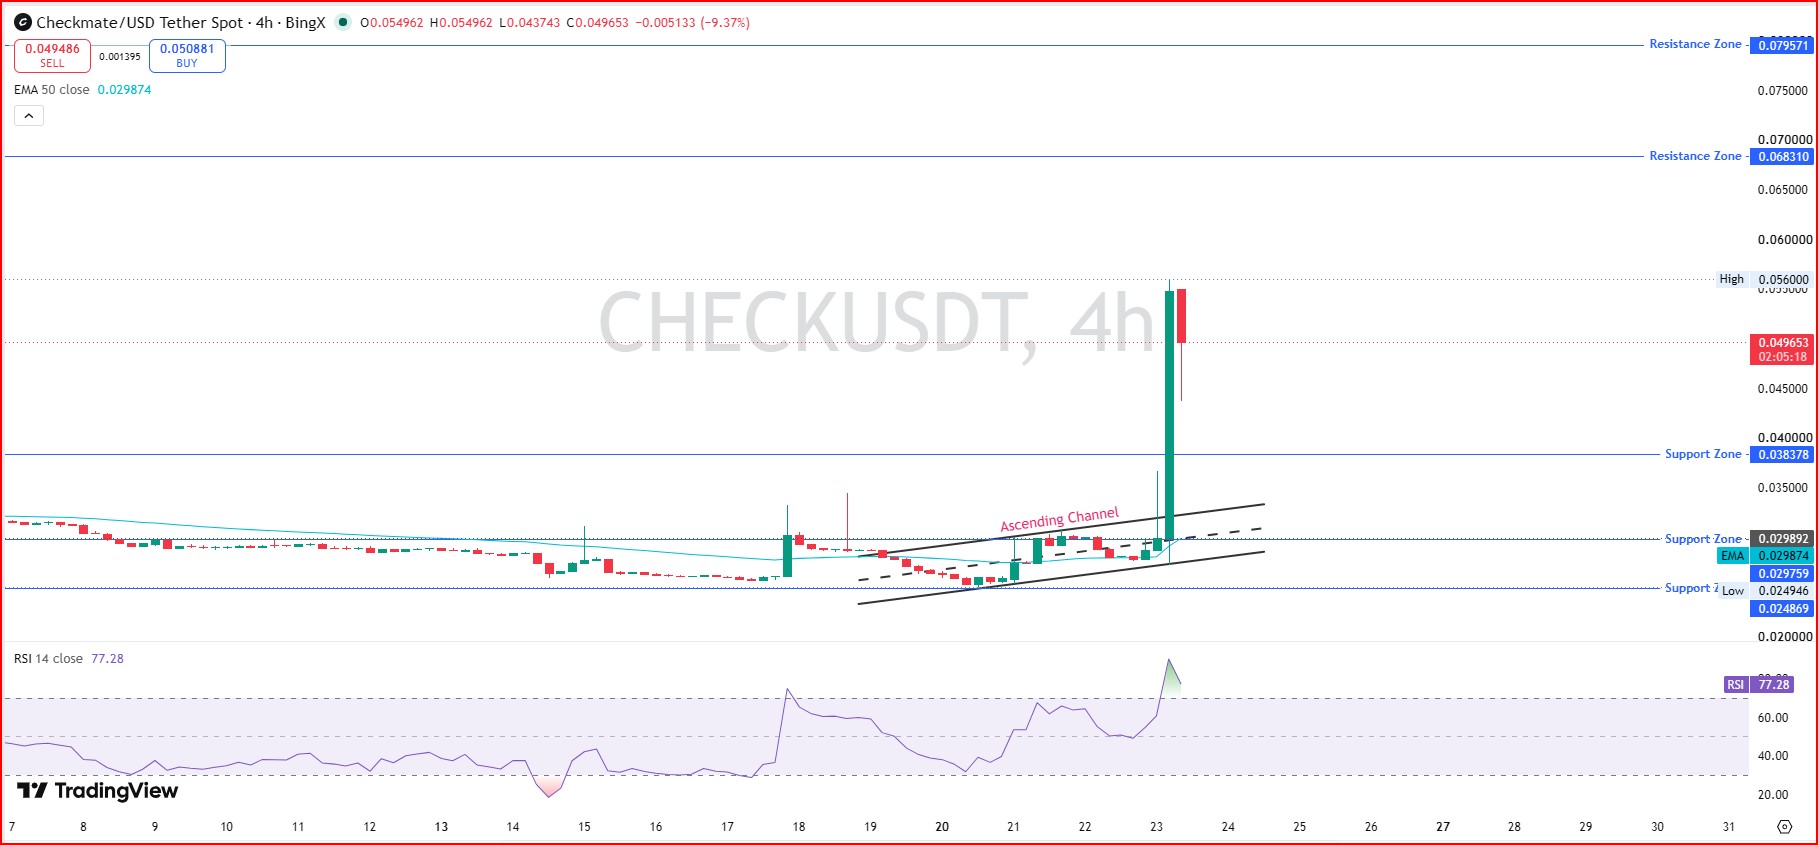
The 50-period EMA, a moving average that smooths out short-term noise by weighting recent candles more heavily, sits at $0.02987. The price is trading well above it. That's a healthy sign for trend strength, but it also means this move stretched fast, not unlike the kind of overextension we flagged in our recent ETH price outlook and forecast.
RSI on the 4-hour chart reads 77.28. That's overbought. Anything above 70 usually signals the move got ahead of itself, and a pullback or sideways chop often follows before the next leg.
That's not a reason to panic. It's a reason to expect turbulence.
Support and Resistance Levels to Watch
On the 4-hour chart, the first resistance sits at $0.0684 and the second at $0.0796. Support zones line up at $0.0389 and $0.0299, with a lower shelf at $0.0249 near today's low.
On the weekly chart, resistance stacks at $0.0657 and then $0.1020, close to the prior high before the all-time peak. Weekly support holds at $0.0260, with deeper support down at $0.0151 to $0.0173. Rejections at resistance bands like this tend to echo the resistance rejection pattern seen recently in larger-cap tokens too.
When we pulled up the Etherscan contract data, the thin liquidity behind these levels was the first thing that stood out.
Price Targets and Their Individual Invalidation Levels
Target one: a retest of $0.0657, the first weekly resistance zone. This level lines up with where CHECK topped out multiple times before the recent breakdown, making it a natural magnet for sellers looking to exit near breakeven. Invalidation: a 4-hour close back below $0.0389 would suggest the breakout failed.
Target two: an extension toward $0.0796, the second 4-hour resistance zone, achievable if RSI cools into the 50 to 60 range without price dropping much, a pattern traders sometimes call a bullish RSI reset. Invalidation: a close under $0.0299 on the 4-hour chart would remove the higher-low structure this target depends on.
Target three: a stretch run at $0.1020, the weekly resistance zone just under the all-time high. This needs sustained volume, ideally daily turnover staying above $5 million for multiple sessions, and a weekly close above $0.0657 first. This kind of capital rotation is worth watching against broader capital rotation trends between majors too. Invalidation: a weekly close back under $0.0260 would end the bullish structure and open the door back toward the descending channel lows.
Bear Case: What Could Go Wrong
And here's the other side. RSI at 77 on the 4-hour chart doesn't stay there forever. Overbought conditions resolve one of two ways: a sharp pullback or a sideways grind that lets RSI cool while price holds.
If sellers step in aggressively, $0.0389 gets tested first.
Should that support zone crack, the next stop is $0.0299, then $0.0249. Below that, this rally starts looking like a one-day news spike rather than a structural trend shift. Sudden market-wide volatility events elsewhere in the market can also drag small-cap altcoin market movements down regardless of a token's own fundamentals. That's the risk. It's a real one.
Holder Concentration: The Number That Should Worry You
Turns out, the technicals are only half this story. Etherscan data shows CHECK has 171 total holders, and the top five wallets alone control 90.87% of the market cap. Whale concentration sits at 99.83%. The Gini distribution score, a measure of inequality where 1.0 means total concentration in one hand, reads 0.971.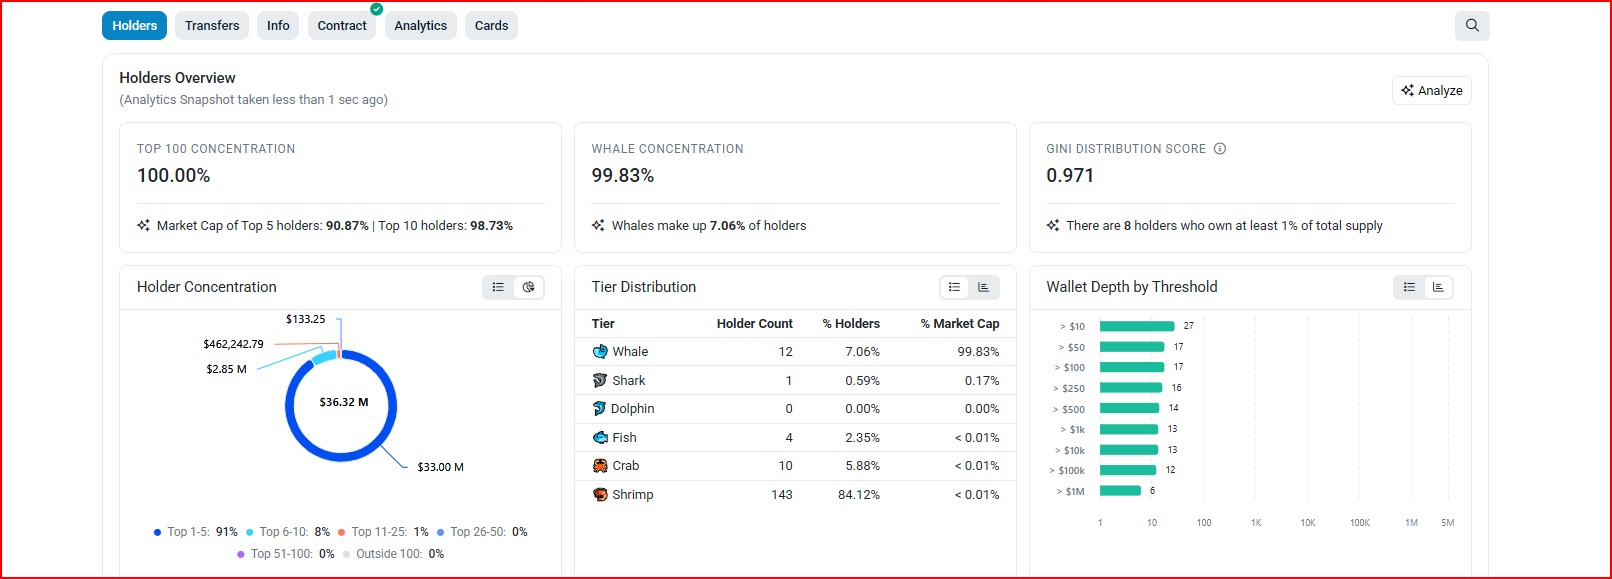
That's about as concentrated as a token gets.
Basically, a handful of wallets could move this market alone. Liquidity relative to market cap sits at just 4.24%, thin by most standards for a listed token. Thin liquidity plus heavy concentration means price swings, in either direction, can happen fast and hard, a dynamic worth comparing against ETF inflow and demand analysis on more liquid assets.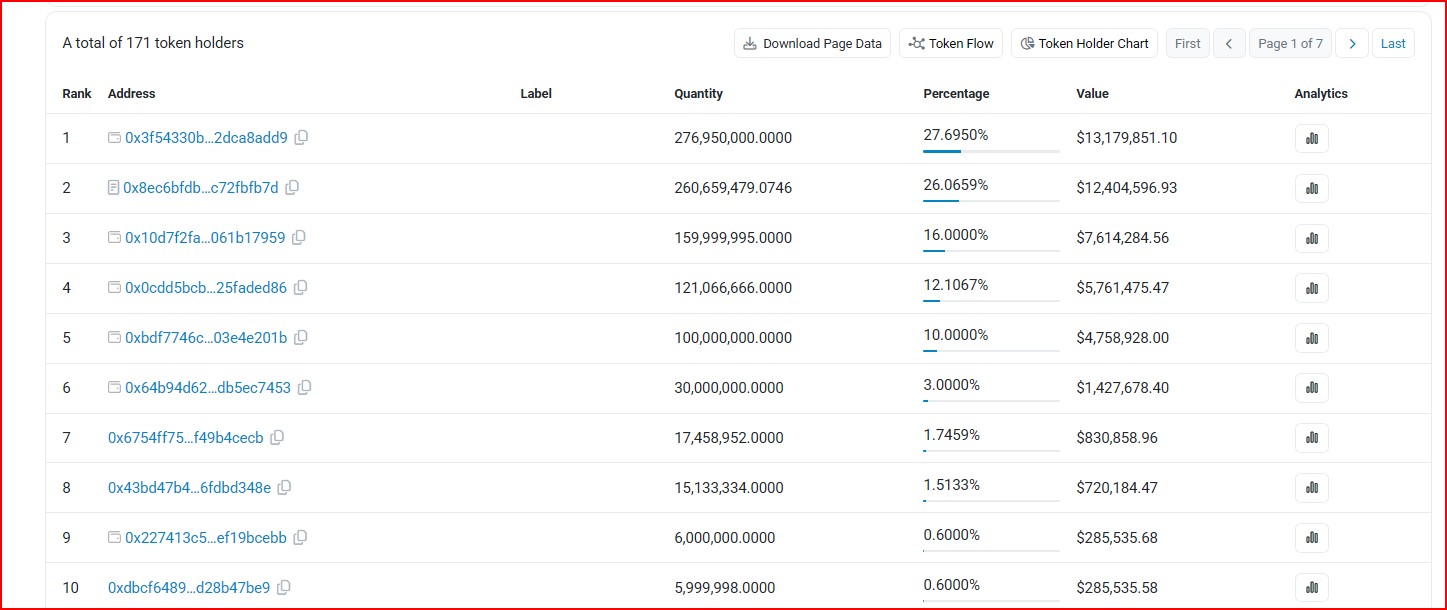
When we pulled up the holder table, the top wallet alone held nearly 28% of circulating value. That's not a footnote. That's the single biggest risk sitting under this entire rally.
FDV, Unlocks, and the Supply Overhang
CHECK has a fully diluted valuation, or FDV, meaning the total value if every token that will ever exist were in circulation today, of roughly $48 million against a current market cap near $14.68 million. The circulating supply data on Etherscan shows 305.98 million out of a 1 billion max supply. That means close to 70% of total supply isn't circulating yet.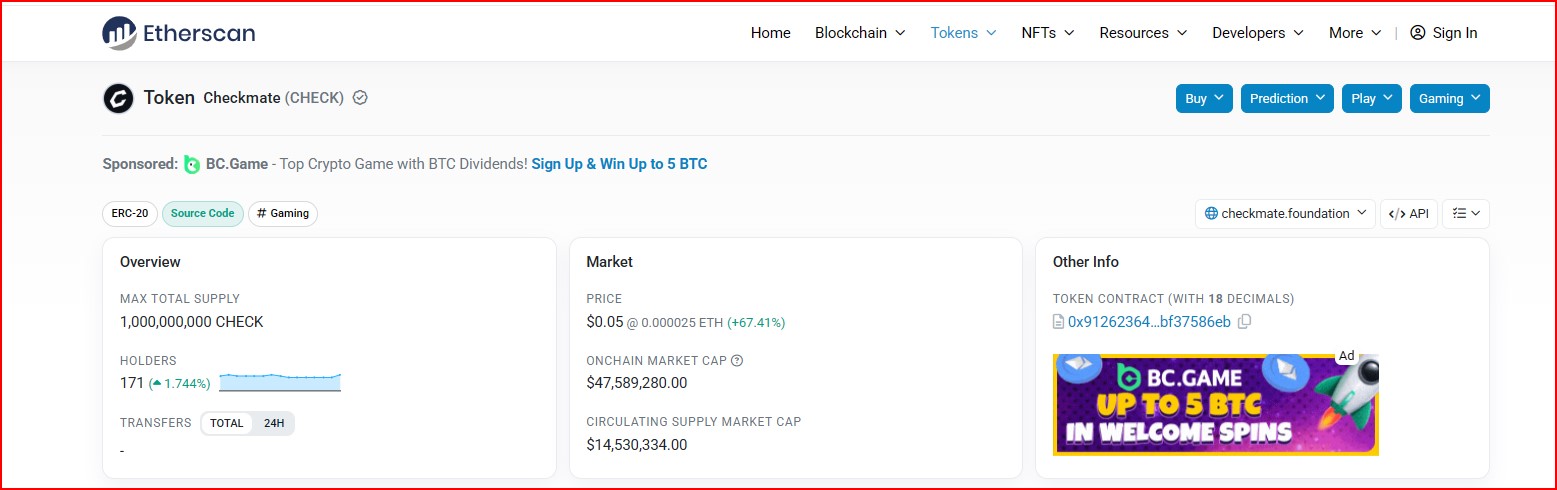
That gap matters. As more tokens unlock and enter circulation, they add sell pressure unless demand grows to absorb them. It's the same overhang that shows up in fresh token presale and IDO listings once vesting schedules kick in. This is the kind of detail that gets ignored during a green candle and remembered during a red one.
Our Take: Bullish Short Term, Cautious Beyond That
We'll say it plainly instead of hiding behind "analysts are divided." The near-term setup favors more upside. A real catalyst, a breakout on both the weekly and 4-hour charts, and RSI that isn't maxed out on the higher timeframe all point the same direction.
But the overbought 4-hour RSI, the extreme holder concentration, and the looming supply unlock overhang mean this isn't a straightforward buy-and-hold story. Short-term traders have a case here. Long-term holders need to think hard about that 0.971 Gini score before committing size, the same discipline behind any long-term holding strategy worth studying before adding conviction size to a thin-liquidity token.
The chart does not lie. Neither does a Gini score of 0.971.
Disclaimer
This article is for informational purposes only and does not constitute financial, investment, or trading advice. Cryptocurrency markets, and low-cap tokens like CHECK in particular, are highly volatile, thinly traded, and carry significant risk, including the risk of total loss. Price levels, targets, and invalidation points discussed here are based on technical chart patterns and public on-chain data at the time of writing and are not guarantees of future performance. Always do your own research and consult a licensed financial advisor before making any investment decisions.
Also read:

















