$1B Market Cap Drops Sharply, What’s Next? Pi Network Price Prediction


Pi Network built one of the biggest communities in crypto by letting people mine PI right from their phones, years before the token ever hit an exchange.
That patience turned into a massive holder base once trading opened up, and PI still draws a crowd every time the project makes headlines.
This Pi Network Price Prediction looks at PI right after its short-term uptrend just broke down, with price slipping below a support line that had held for weeks.
That kind of break tends to grab attention fast, and traders who've been watching PI climb don't want to miss what happens next.
Market data was checked on August 17, 2026, at 17:08 IST.
Pi Network Price Prediction Today: Market Overview
Metric | Value |
Price | $0.08635 |
24h Change | -0.16% |
Market Cap | $952.13M |
24h Volume | $7.03M |
Vol/Mkt Cap (24h) | 0.7366% |
FDV | $8.62B |
Total Supply | 100B PI |
Max Supply | 100B $PI |
Circulating Supply | 11.04B $PI |
Source: Data from CoinMarketCap as of August 17, 2026, at 17:08 IST. Figures may vary slightly across other tracking websites.
PI Network News: Development Keeps Shipping While the Token Lags
Crypto news account BSCN reported that the Pi Core Team released Node version 0.6.2, adding SoloHost and connectivity upgrades, a day after the network's operational mainnet app count reached 82 on its way to a 100-app milestone.
Source: Data from X
The team also reported completing a distributed computing test. Despite that pace of development, BSCN noted PI has drifted below a $1 billion market cap, trading near $0.088 at the time of the report, down 3.4% on the week, with daily volume around $6.3 million.
That's a slightly earlier snapshot than the live figures above, but it lines up with the same overall picture: steady building on the tech side hasn't yet translated into price strength.
$PI Price Prediction Chart: Technical Analysis
Pair: $PI/USDT · Market: Spot (Crypto) · Exchange: OKX · Timeframe: 4H · Source: TradingView · Timestamp: August 17, 2026, 16:08 UTC+5:30
$PI is trading at $0.08635 after breaking down from a short-term uptrend. Since late July, the price had been climbing along a rising trendline, with each pullback finding a higher low than the one before it, a classic sign of buyers staying in control.
$PI fell hard enough to break below that trendline, and it's now trading under both EMA (Exponential Moving Average, a line that tracks the average price over time, weighted toward recent candles) levels too, with the EMA 20 at $0.08726 and the EMA 50 at $0.08779 sitting just above the current price.
When a rising trendline like this breaks, it usually means the short-term uptrend has lost momentum.
The RSI (Relative Strength Index, a momentum indicator that measures how fast and how far price has moved) is at 40.79, below the midline, continuing to hold up the downward trend.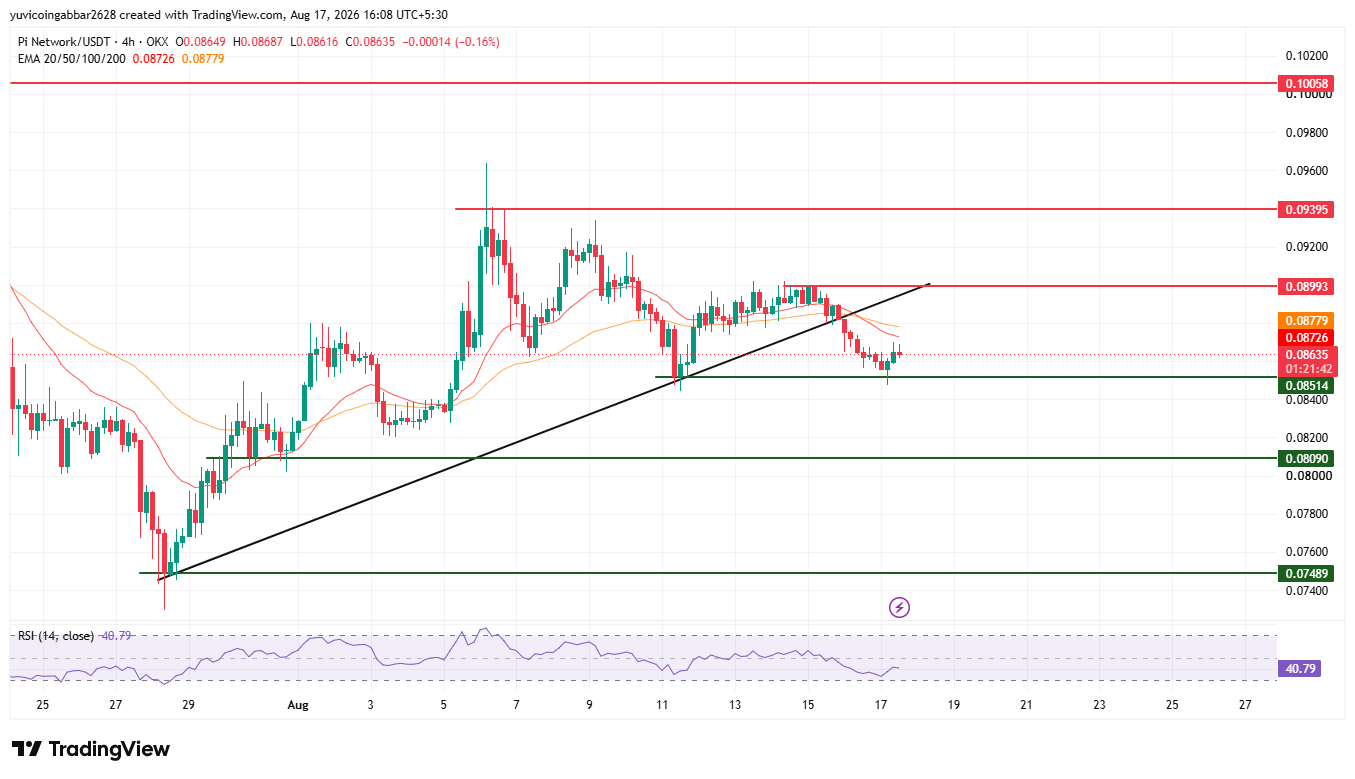
Support and Resistance Levels
Level Type | Price |
Resistance 3 | $0.10058 |
Resistance 2 | $0.09395 |
Resistance 1 | $0.08993 |
Immediate Price Reference | $0.08635 |
First Support | $0.08514 |
Deeper Support | $0.08090 |
Structural Floor | $0.07489 |
EMA Levels
EMA | Price |
EMA 20 | $0.08726 |
EMA 50 | $0.08779 |
RSI (14) | 40.79 |
Pi Network Forecast: Bull Case vs. Bear Case
$PI price target 2026 Bull case: Holding above $0.08514 would keep $PI from sliding further and give it a shot at climbing back through the EMA cluster near $0.08726 to $0.08779.
A recovery of the resistance zone at $0.08993 would suggest the uptrend is trying to regain itself, opening a path toward $0.09395.
$PI price target 2026 Bear case: The support break is a warning sign, and a close below $0.08514 would confirm sellers have taken over the short-term trend.
That would put $0.08090 in play, with a deeper break exposing the structural floor at $0.07489.
$PI Price Scenarios: Triggers and Invalidation
Scenario | Trigger | Likely Outcome | Invalidation Point |
Trendline reclaim | PI closes above $0.08993 | The uptrend resumes, moving toward $0.09395 | Rejection at $0.08993 |
Channel hold | Price stays above $0.08514 | Sideways consolidation before the next move | Close below $0.08514 |
Channel breakdown | Price closes below $0.08514 | Drop toward $0.08090 and the $0.07489 floor. | Reclaim of $0.08514 |
$PI Price Target: Can $PI Reach $0.10058?
$0.10058 is the highest resistance level marked on the chart.
Getting there would require $PI to first reclaim the resistance zone at $0.08993, clear both EMA lines above the current price, and then push through $0.09395.
That's a full trend reversal rather than a quick bounce, and the current setup doesn't point to it happening fast.
What Could Invalidate the Bullish Setup?
A rejection at the EMA cluster near $0.08726 to $0.08779 followed by a close below $0.08514 would confirm the trendline break is holding and put any recovery attempt on hold.
A further break below $0.08090 and the structural floor at $0.07489 would suggest the pullback has more room to run.
Pi Network Price Prediction: Expert View
According to CoinGabbar analysts, the broken ascending trendline is the key development here.
$PI had been climbing in an orderly uptrend since late July, and that structure just gave way, with the price now trading below both EMA lines and an RSI that's slipped under the midline.
None of that lines up with the steady stream of development news coming from the $Pi Core Team, which is a common disconnect in crypto: the tech can keep shipping while the token drifts on its own schedule.
The $0.08514 level is the one to watch. Hold it, and $PI has a shot at stabilizing. Lose it, and $0.08090 becomes the next real test.
Disclaimer: This piece is for informational purposes only and isn't financial advice. The levels and scenarios above are based on technical chart analysis and publicly available data at the time of writing, and crypto markets can move sharply within hours, so past patterns don't guarantee future outcomes. It's worth doing independent research and considering your own risk tolerance before acting on any of the levels discussed here.
Also read:













.webp)








