Lighter Price Prediction: $LIT Bulls Target a New High Near $3


LIT just pulled off something it hadn't managed in weeks, breaking out of a falling channel with a real move behind it, up over 9% today.
That part's encouraging. Whether it sticks is the actual question.
This lighter price prediction really comes down to one thing: do buyers show up with volume to back this breakout, or does it turn into another fakeout that gets sold right back into the range it just escaped?
$LIT Live Market Data
Lighter is currently trading at $2.40 and up today 9.2%. Prices ranged between $2.18 and $2.43 in that window.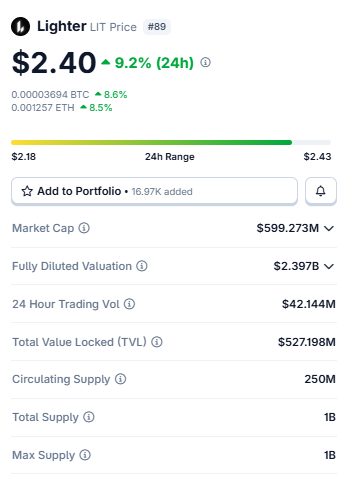
Source: $LIT Market Cap Data Taken From Coingecko, data as of Aug 07, 2026. Figures may vary slightly across other tracking websites.
Market cap sits at $599.273M, and the fully diluted valuation is way out at $2.397B, since the circulating supply of 250M is still just a quarter of the 1B total and max supply.
Volume over the past 24 hours hit $42.144M, with $527.198M locked into the protocol itself.
Liquidation Snapshot
The liquidation numbers are worth a look here. $172.08K in shorts got wiped out over.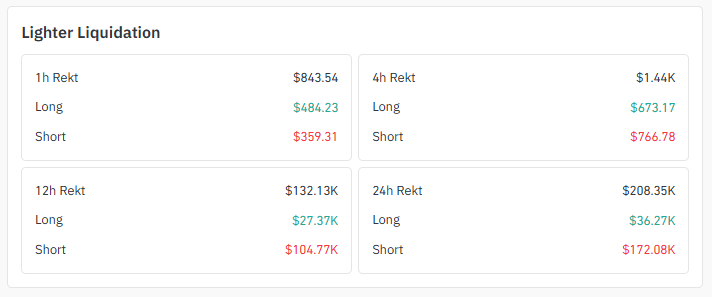
Source: Liquidation Data Taken From Coinglass.
24 hours versus just $36.27K in longs, a pretty clear sign traders betting against LIT got caught leaning the wrong way today.
That kind of imbalance can add fuel to a breakout, since squeezed shorts sometimes have to buy back in just to close out.
Exchange Volume
Binance's out front on LIT futures, $36.37M over 24 hours; OKX next at $26.32M.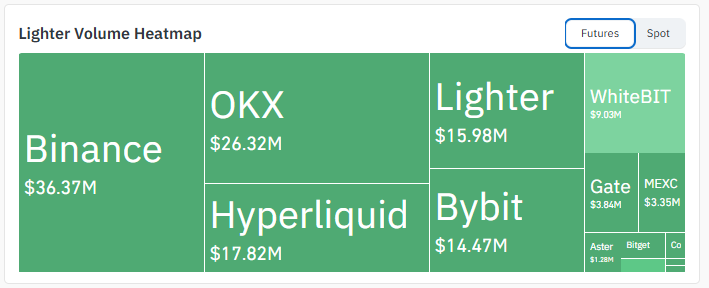
Source: Volume Heatmap Data Taken From Coinglass.
Lighter's own platform pulls $15.98M, Hyperliquid adds $17.82M, Bybit contributes $14.47M. WhiteBIT, Gate, MEXC, and Aster fill in the rest with smaller but still real volume.
Spread across that many venues, this looks like broad interest, not one exchange carrying the whole thing.
$LIT Social Sentiment:
There's a slower-burning story here too.
An early Ethereum holder, tracked as wallet 0x7378, has been steadily building a LIT position over the past two months, spending roughly $9.1 million to pick up 3.91 million tokens at an average cost near $2.33 each. 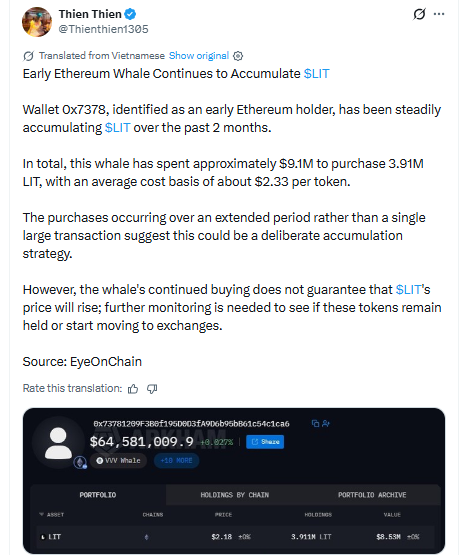
Source: Data Taken From @Thienthien1305 , X Account.
Spread out over time like that instead of one lump buy, it looks like a deliberate accumulation play rather than a quick flip.
That said, buying alone doesn't guarantee price keeps climbing; whether these tokens stay held or eventually make their way to exchanges is something worth watching.
Key Takeaways
-
LIT's up 9.2% today, sitting near $2.40, right after finally breaking out of a channel that had it stuck for weeks.
-
Hold this breakout with volume, and $2.7643 shows up next, with a Fibonacci extension all the way up at $3.2513 beyond that.
-
Fail to hold it, though, and the price probably falls back toward $1.9764, maybe $1.7130 if the drop really runs.
-
On the shorter 4H chart, LIT's testing a falling trendline and a resistance zone at the exact same time right now.
-
An early Ethereum whale has quietly built a $9.1 million LIT position over the past couple months.
4H Chart: Trendline and Resistance Together
Pull up the 4H chart, and LIT's fighting two things at once, a falling trendline and a resistance zone sitting almost right on top of each other near where price is now. 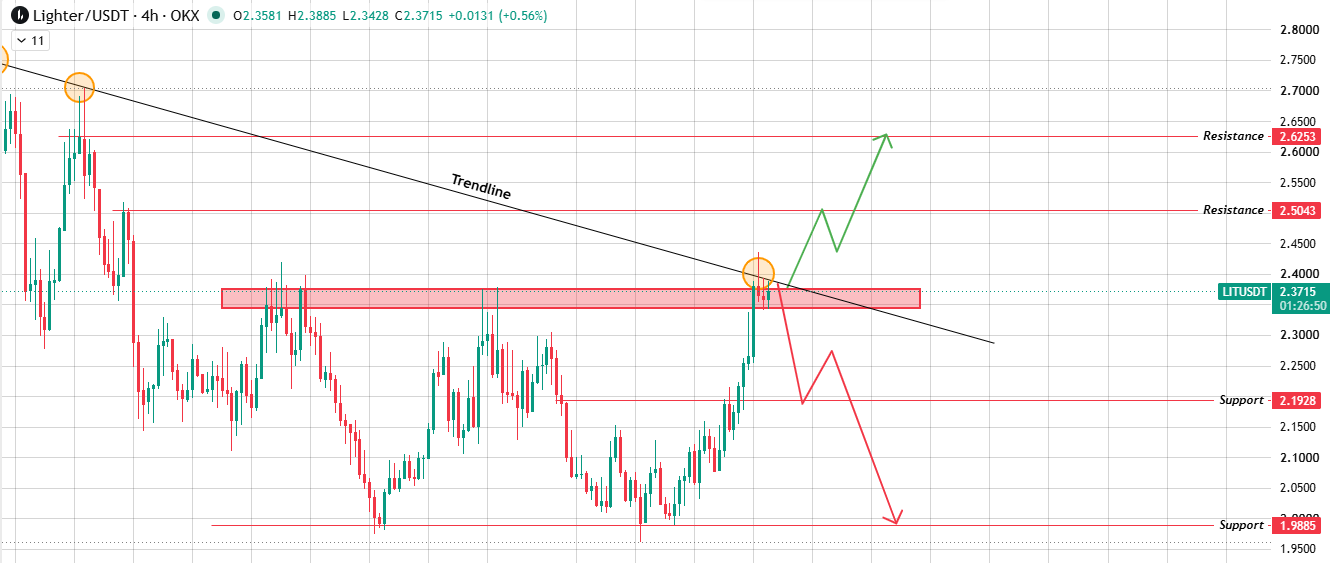
Source: Chart Taken From TradingView .
That's rarely just coincidence; it usually means the level actually matters.
Clear both with real volume, and the chart opens up first at $2.5043 and then at $2.6253 if buyers keep at it.
Get pushed back here instead, like this trendline's done before, and the price could slide toward $2.1928, maybe $1.9885 if sellers really grab hold.
1D Chart: Channel Breakout, Now the Real Test
Step back to the daily, and the bigger picture gets more interesting. LIT had been sliding down a descending channel for a while, then it broke above it.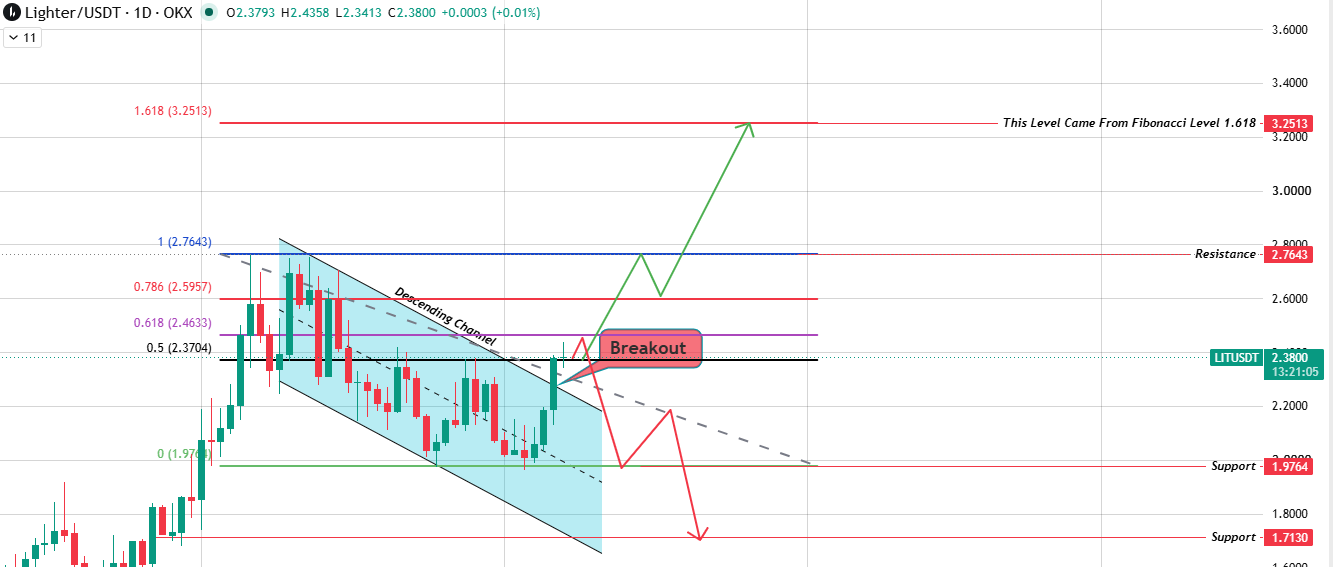
Source: Chart Taken From TradingView.
Hold that breakout with volume, and $2.7643 becomes the first real level.
Past that sits a Fibonacci extension near $3.2513, the kind of number that only comes into play if this move has genuine strength behind it, maybe even a run at new highs if momentum carries that far.
But breakouts fail plenty too. If this one does and price slips back inside the old channel, $1.9764 is what to watch, with $1.7130 as a deeper floor if it's a real breakdown.
Bull, Base, and Bear Scenarios
| Scenario | Trigger | Level 1 | Level 2 |
|---|---|---|---|
| Bull | Breakout holds with volume on both timeframes. | $2.5043 / $2.7643 | $2.6253 / $3.2513 |
| Base | The price consolidates just above the old channel. | $2.20 - $2.45 | Awaiting confirmation |
| Bear | Breakout fails, and the price falls back into the channel. | $2.1928 / $1.9764 | $1.9885 / $1.7130 |
Risks
No breakout happens in a bubble.
A shift in BTC dominance, or a change in how altcoins are tracking ETH, could easily pull LIT along regardless of what its own chart says.
Breakouts fail more often than people expect too, especially on smaller tokens like this one, so waiting on volume confirmation beats chasing the first green candle.
Glossary
Descending Channel: Two parallel falling lines with price bouncing between them until something finally sends it outside that range.
Fibonacci Extension: A tool traders use to project price levels past a breakout, based on how big the prior move was.
Liquidation: When a leveraged position gets forced shut because price moved too far the wrong way.
Methodology: Levels in this Lighter price prediction come straight from TradingView chart analysis on the 4H and 1D timeframes, alongside liquidation, volume, and market data pulled at the time of writing. Numbers can shift as the market does.
Disclaimer: This article is for informational purposes only and does not constitute financial advice. Cryptocurrency markets are highly volatile and speculative. Always do independent research and speak with a licensed financial advisor before making investment decisions.
















