Official Trump Price Prediction: What Is Next for TRUMP in 2026?


Officials at the White House spent Wednesday talking about Bitcoin reserves and a coming Crypto Clarity Act, and $TRUMP, the market's most literal $Trump trader, responded fast: it broke out of a multi-week descending wedge and then gave back a chunk of the move within a single session.
This Official Trump price prediction covers what the chart shows, what's driving the move, and why buyers haven't fully committed yet.
What Is Driving the Official Trump Price Prediction Today?
As per CoinMarketCap data, TRUMP is trading at $1.67, up 18.6% over 24 hours, after spiking as high as $1.86 before easing back.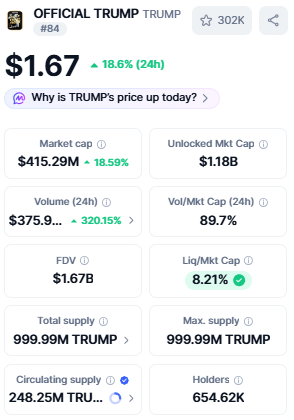
The 4-hour figure is down 4.93% even as the daily gain holds. Market cap has climbed to $415.29M, up 18.59%, while 24-hour volume has surged 320.15% to roughly $375.9M, a volume/market cap ratio of 89.7%.
Total and max supply sit at 999.99M $TRUMP, with circulating supply at 248.25M and 654.62K holders.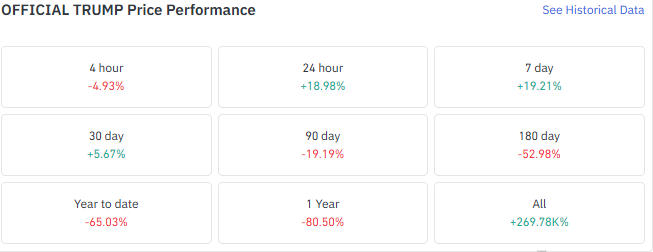
Performance is mixed: $TRUMP is up 19.21% over seven days and 5.67% over 30 days but down 19.19% over 90 days, 52.98% over six months, and 65.03% year-to-date.
What's Behind the White House Crypto Summit Rally?
The move lines up with a White House crypto summit that generated heavy headline flow overnight.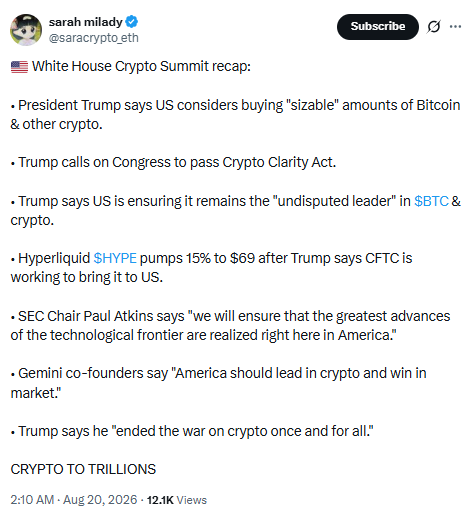
Trump reportedly said the US is considering buying sizable amounts of Bitcoin and other crypto, called on Congress to pass the Crypto Clarity Act, and said he had "ended the war on crypto once and for all."
SEC Chair Paul Atkins echoed the sentiment on US leadership in tech, and Hyperliquid's
HYPE jumped 19% after $TRUMP said the CFTC was working to bring it to the US. For a token this tied to its namesake, headlines like these move price directly, a factor central to any Official Trump price prediction right now.
What Does TRUMP's Chart Show Right Now?
On the TradingView daily chart, TRUMP spent weeks compressing inside a falling wedge, price squeezed between two converging downward-sloping trendlines as the range narrowed.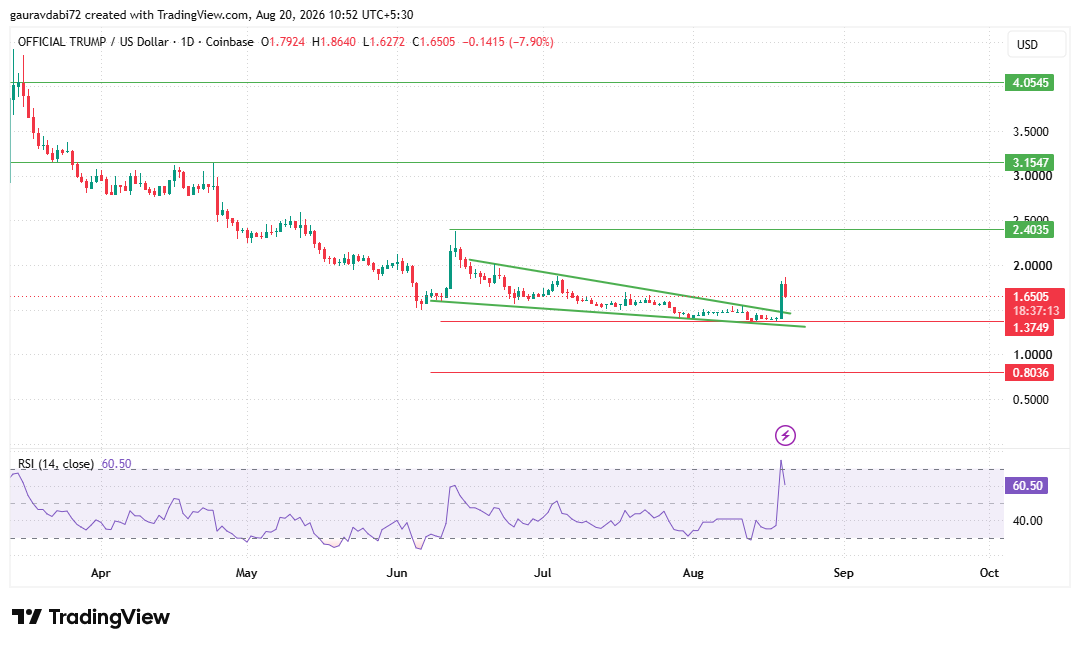
That compression resolved with a sharp green candle spiking well above the wedge's upper boundary, a genuine breakout after weeks of contraction.
Price has since pulled back from the highs of that move but is still trading above the wedge structure rather than back inside it, keeping the breakout technically intact.
Support, Resistance, and What Could Change the Picture
Support sits at $1.3749 in the near term, with $1.000-$0.8036 marked as a deeper psychological support well below the current price.
On the upside, $2.4035 is the first resistance, followed by $3.1547 and $4.0545 if the breakout holds. RSI(14) is at 60.50, bullish but nowhere near overbought, leaving room to extend.
A recovery case exists: $TRUMP has broken above its downtrend, RSI is climbing without being stretched, and volume is well above average.
What's missing is confirmation of a close that holds above the wedge breakout level over multiple sessions rather than a single spike that gets sold into.
Continued policy momentum out of Washington and a sustained pickup in open interest would support that case; the token's deeply negative yearly and all-time performance, plus this week's immediate pullback near resistance, are the clearest risks against it.
A sustained close and hold above the wedge breakout, followed by a break of $2.4035, would put $3.1547 and $4.0545 in play through 2026 as part of this Official Trump price prediction.
Without that, TRUMP is more likely to fall back inside the wedge, testing $1.3749 and the deeper $0.8036 support again
What Are Futures Markets Signaling?
As per CoinGlass, open interest has jumped to $119.51M, its highest level since a spike in mid-June, rising with the price surge.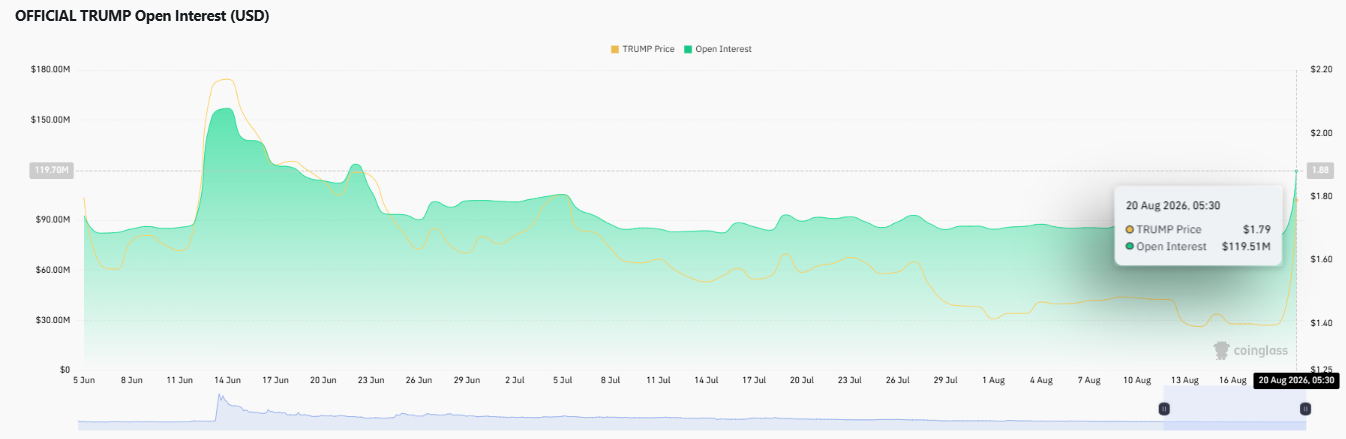
Liquidations totaled $2.92M over 24 hours: $1.22M in longs and $1.70M in shorts, with shorts taking the bigger hit.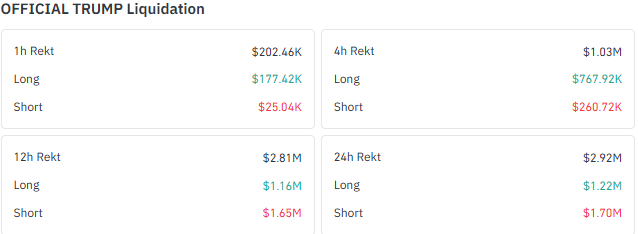
Positioning leans bullish: Binance's long/short ratio is 1.71, OKX's is 1.51, and Binance's top traders are more skewed long at 1.942 by account and 2.2852 by position.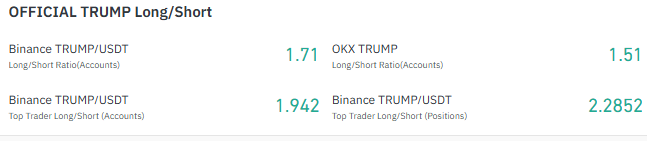
Binance and OKX lead futures volume at $281.81M and $194.45M.
Analyst View
As per the CoinGabbr analyst, the pattern is familiar for a token this tied to headline-driven demand: a powerful move on real catalysts, followed by a fast give-back as short-term buyers take profit.
The break above the channel is meaningful after weeks of decline, but the quick rejection back toward its upper boundary shows the market hasn't decided whether this is a genuine reversal or another failed attempt within a broader downtrend.
Derivatives positioning is skewed long, and open interest is climbing, so fresh money is clearly entering.
The question is whether it's early for a real move or chasing one that's already played out.
Disclaimer: This article is for informational purposes only and does not constitute financial or investment advice. Cryptocurrency markets are highly volatile and carry significant risk; please conduct your own research before making any investment decisions.