Official Trump Price Prediction: TRUMP Flash a Powerful Bullish Signal


So where's $TRUMP headed? This official Trump price prediction really comes down to whether the daily wedge breaks up or down.
Clear the upper boundary with volume behind it, and there's real room to run higher.
Lose support instead, and the path leads toward a deeper Fibonacci level before buyers get another shot at stepping in. Either way, the next few candles matter more than usual right now.
Live $TRUMP Price Data
$TRUMP is currently trading around $1.44 right now, down 1% on the day after moving between $1.43 and $1.46 over the last 24 hours.
Market cap comes in at $356.972M against a fully diluted valuation of $1.438B, with 248.251M tokens circulating out of a fixed 1B total and max supply.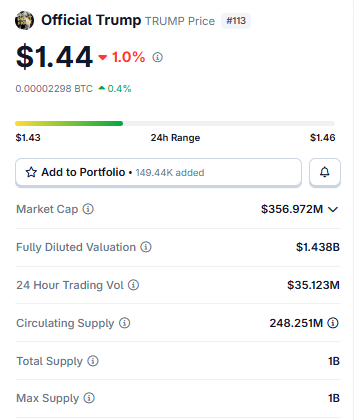
Source: Market Cap Data Taken From Coingecko, data as of Aug 03, 2026. Figures may vary slightly across other tracking websites.
That fixed cap means there's no unlock schedule to worry about here, unlike a lot of other tokens on this list. 24-hour volume landed at $35.123M, a decent number that suggests real trading interest even as price grinds lower.
Exchange Volume and Liquidation Snapshot
Volume here is heavily weighted toward Binance at $19.46M and OKX at $13.54M, with Bybit, Gate, and Bitget making up the rest of the meaningful activity, plus smaller contributions from WhiteBIT, Bitunix, and KuCoin. 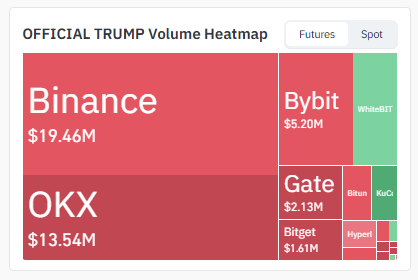
Source: Volume Heatmap Data Taken From Coinglass.
That kind of concentration means big orders on either of those top two venues can swing the price more than you'd see on a more evenly spread token.
Liquidations over the past 24 hours totaled $58.18K, and longs took almost all of the pain at $56.58K against just $1.60K in shorts. 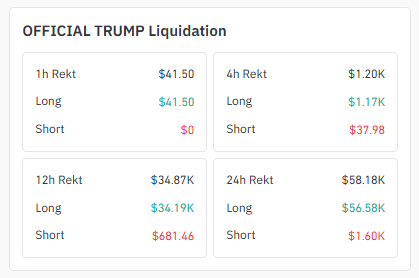
Source: Liquidation Data Taken From Coinglass.
The 12-hour window shows the same lopsided pattern, $34.19K in long liquidations versus $681.46 in shorts, which fits a token that's been sliding and catching leveraged buyers off guard along the way.
Key Takeaways
TRUMP is sitting near $1.44, down 1% on the day, still stuck inside a daily falling wedge.
Break the wedge's upper boundary on volume, and $1.710 opens up first, with $2.014 the bigger target after that.
Get rejected instead, lose the $1.406 support, and the chart points toward a Fibonacci-based level near $1.219.
On the 1H chart, TRUMP is inside a tighter descending channel. Clear the upper boundary, and $1.455 comes next, then $1.466.
Break the channel's lower boundary instead, and $1.422 is the first stop, with $1.406 right behind it.
1H Chart Technical Analysis
Zoom into the 1H chart, and $TRUMP is riding a descending channel, currently sitting right around $1.439 after climbing off a small dip earlier in the session.
Two roads from here. Break the channel's upper boundary on volume, and $1.455 is the first target, with $1.466 possible right after.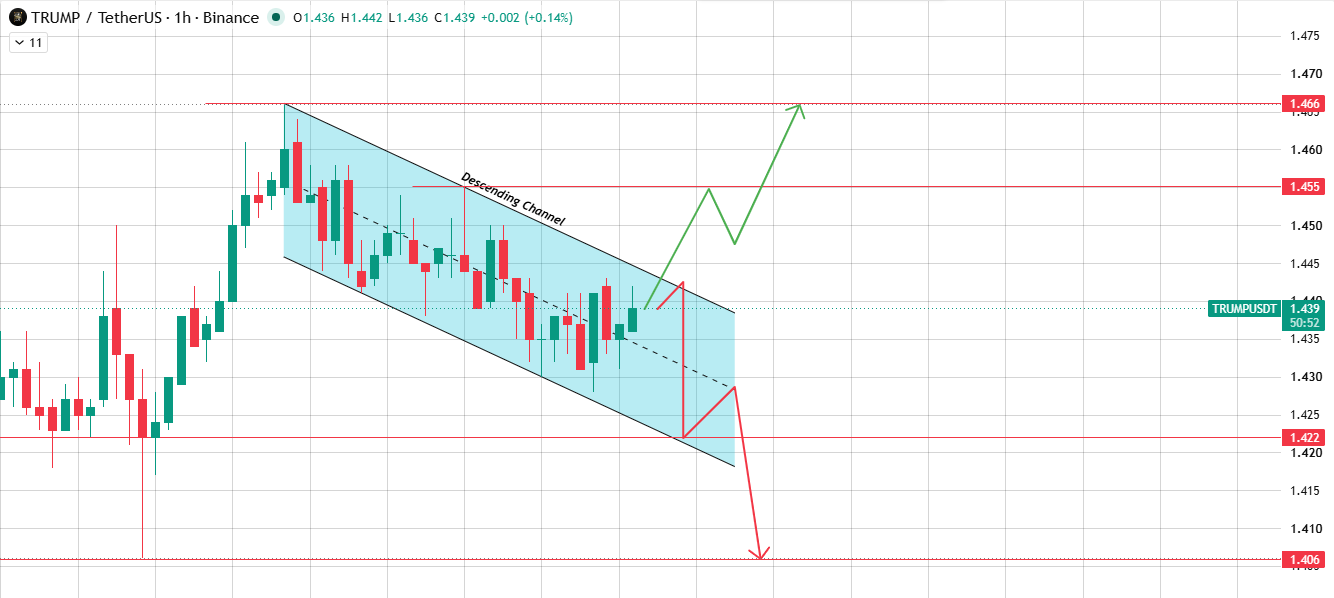
Source: Chart Taken From TradingView.
Break down through the lower boundary instead, and $1.422 comes first, followed by $1.406 if selling pressure keeps up.
This shorter-term channel is basically a smaller version of the same fight playing out on the daily chart, and traders watching both timeframes should expect the two to move in step more often than not.
Daily Chart Technical Analysis
$TRUMP has been grinding lower inside a falling wedge on the daily chart, a pattern that's been forming since price peaked well above $2.00 a few weeks back.
Price is currently testing support near $1.406, right where the wedge's lower boundary lines up with the Fibonacci 1.0 retracement level.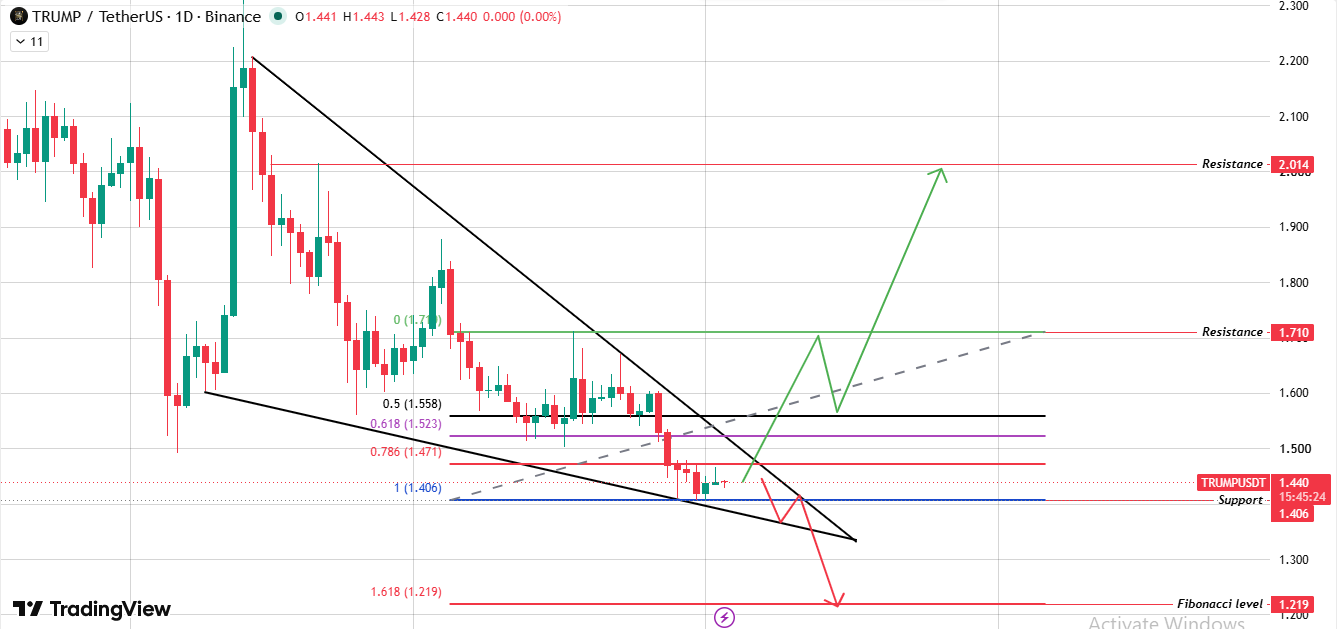
Source: Chart Taken From TradingView.
Here's the setup. A Volume-backed breakout above the wedge's upper boundary and a sustainable move above the 0.5-0.618 Fib area open up $1.710 with $2.014 as the bigger target if that momentum keeps carrying.
But if TRUMP gets rejected from the upper boundary and this $1.406 support gives way, the chart points to a lower Fibonacci extension level of 1.618 near $1.219 as the next likely stop.
Watching how the price reacts around this support over the next few sessions should tell traders which way this wedge wants to resolve.
Bull vs Bear Scenarios
What needs to happen for bulls? A break above the 1H channel's upper boundary toward $1.455 and $1.466, carrying into a daily wedge breakout that opens $1.710 and eventually $2.014.
That kind of move would need genuine volume behind it, not just a quick wick through resistance.
Bears want the reverse. Rejection at the channel and wedge boundaries, a breakdown through $1.422 and $1.406, and a slide toward the $1.219 Fibonacci level on the daily chart.
This official Trump price prediction keeps both scenarios open until a confirmed close settles which side wins out, so it's worth waiting for that close rather than trading off a single candle wick.
Methodology: This one's built on technical analysis of the TradingView 1H and daily charts, current market data, exchange volume, and liquidation data. None of it should be taken as financial advice.
Glossary
Descending Channel: Two parallel lines sloping downward that keep price boxed in as it drifts lower.
Falling Wedge: Converging lines that both slope down, squeezing price into a tighter range until it eventually breaks one way or the other.
Fibonacci Level: A price point drawn from key ratios of a prior swing, used to guess where a move might stall or extend to next.
Support Zone: A spot where buyers have shown up before, so traders keep an eye out for a repeat bounce.
Liquidation: What happens when a leveraged trade gets closed out by force because losses ate through the available margin.
Disclaimer: This $TRUMP price prediction is based on technical analysis and current market conditions. Cryptocurrency markets are highly volatile, and price movements can change rapidly. This content is for informational purposes only and should not be considered financial or investment advice. Always do your own research before making any investment decisions.


















