Pi Network Price Prediction: PI Slides Toward Lows, What Comes Next?


Pi Network price prediction searches are picking up again as $PI holders look for direction after a rough stretch for the token. This $PI Coin price prediction breaks down where $PI stands right now, what the charts and tokenomics say, and a realistic Pi Network price forecast into 2026 and beyond.
Key Takeaways
-
$PI trades near $0.0821, down about 2.3% in the last 24 hours
-
Volume: $8.98M, down 39.51% (Vol/Mkt Cap near 1%)
-
Market cap: $898.3M | FDV: $8.2B
-
Supply capped at 100 billion $PI, with roughly 10.94 billion circulating
-
Just 15.89% above its all-time low of $0.07072, set on July 14, 2026
-
Down 97.25% from its all-time high of $2.98, set February 26, 2025
-
Weekly RSI sits at 24.40, deep in oversold territory
-
CertiK rating stands at 3.5 out of 5
Where $PI Network Stands Right Now
According to the live PI listing on CoinMarketCap, Pi Network trades around $0.0821, with a 24-hour range of $0.08128 to $0.08416. The token's max and total supply both sit at 100 billion $PI, with roughly 10.94 billion $PI in circulation, leaving an FDV of $8.2 billion against a market cap of $898.3 million, a wide gap that keeps showing up in every Pi Network price prediction built around eventual supply.
$PI Network Technical Analysis
4-Hour Chart: The chart structure was reviewed against the live PI/USDT chart on TradingView. $PI has been sliding inside a descending channel and recently broke below it, extending the drop. 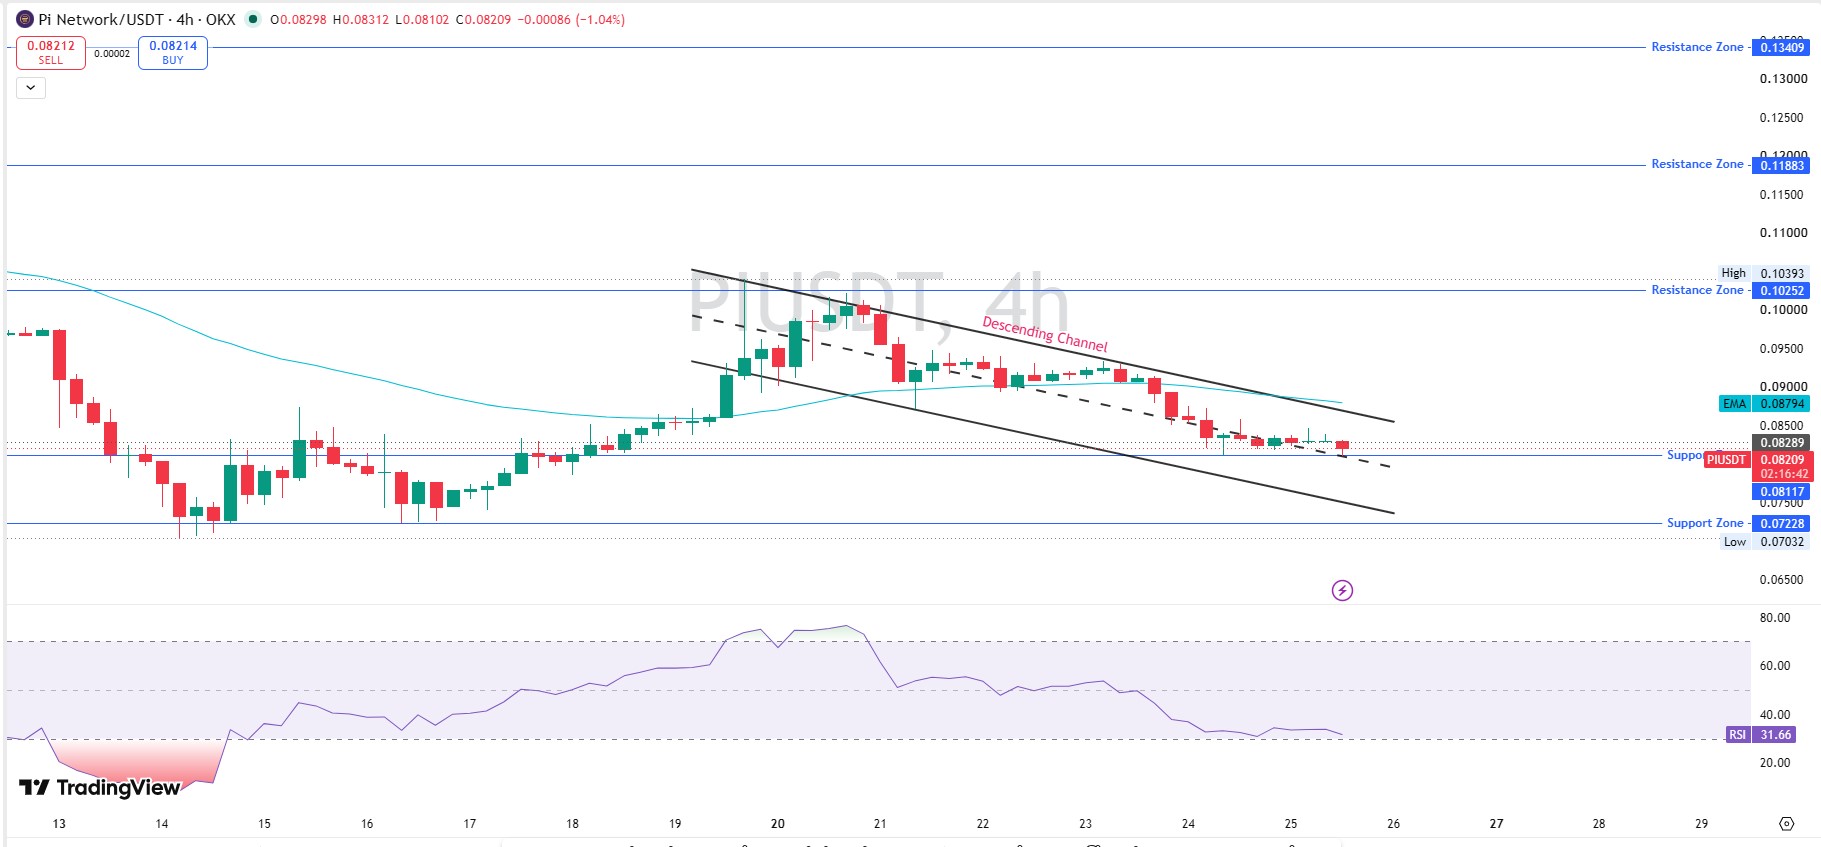
The latest 4-hour candle opened at $0.08298, hit a high of $0.08312 and a low of $0.08102, and closed at $0.08209 (-1.04%). Price is trading below its EMA of $0.08794, keeping the short-term trend tilted toward sellers.
RSI reads 31.66, edging toward oversold but not yet flashing a clean reversal. Resistance: $0.10252 (recent high $0.10393), then $0.11883, then $0.13409. Support: $0.07228, with the recent low of $0.07032 as the floor.
Weekly Chart
On the weekly $PI/USDT chart on TradingView, $PI has spent months grinding lower inside a broad descending channel.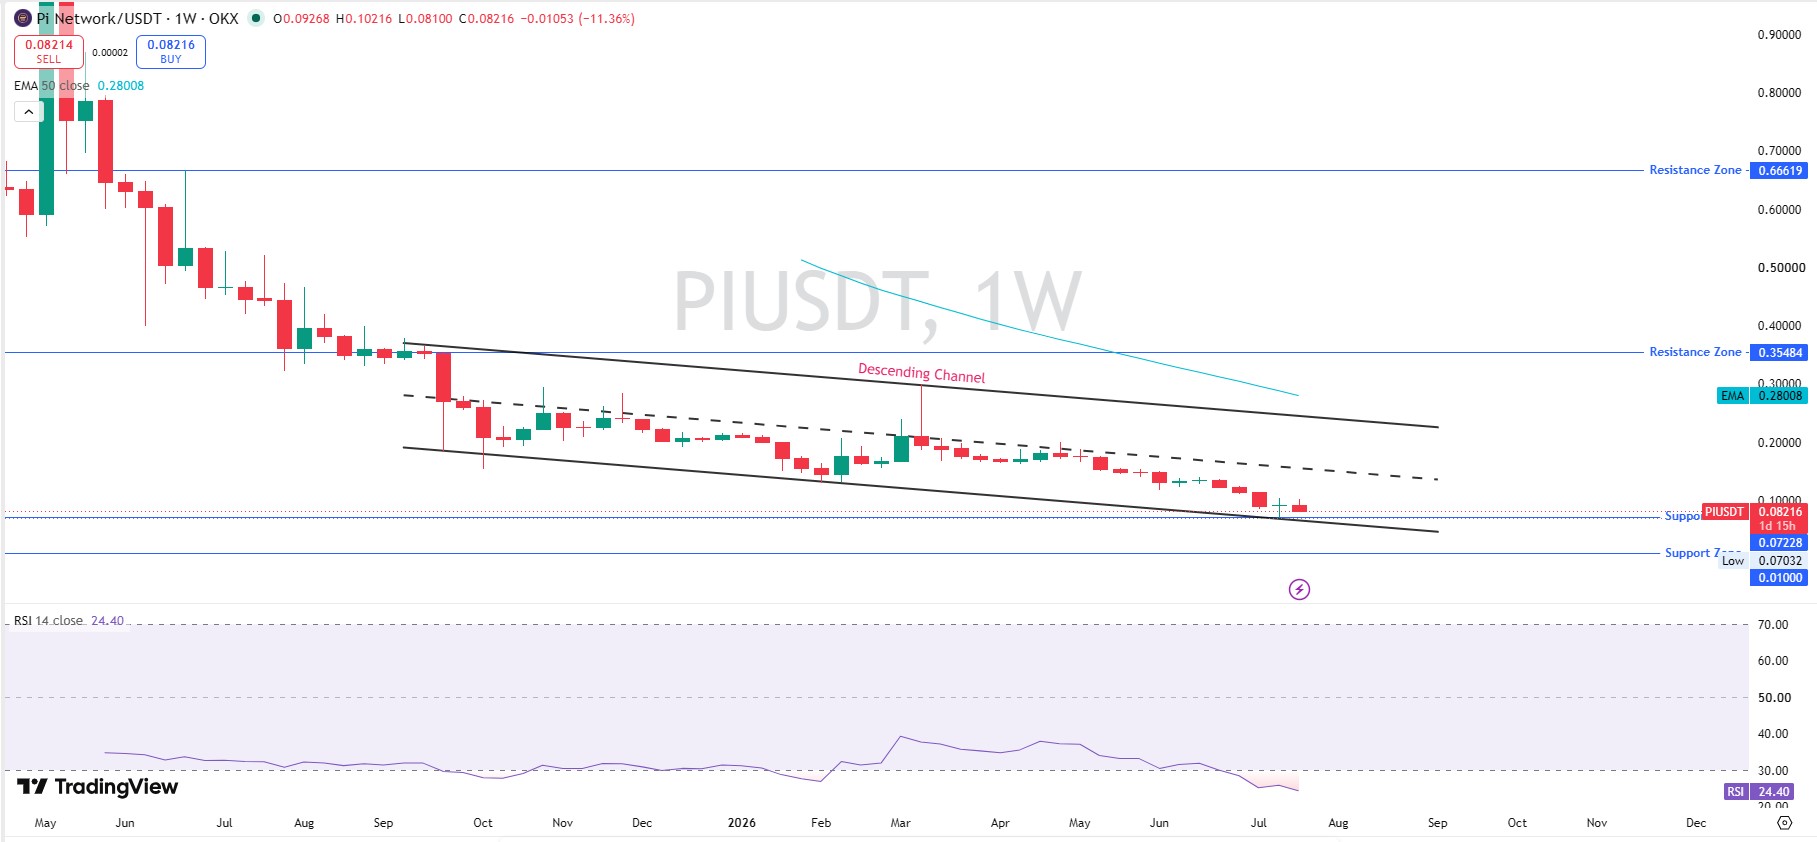
The latest weekly candle opened at $0.09268, hit a high of $0.10216, a low of $0.08100, and closed at $0.08216 (-11.36%), one of the sharper weekly drops in recent months.
Weekly RSI sits at 24.40, deep in oversold territory, a level that has historically preceded short-term bounces even inside larger downtrends. The 50-week EMA near $0.28008 shows how far the price sits below its own average. Resistance stacks at $0.35484, then $0.66619, both well above current levels.
Tokenomics and Supply
Per Pi Blockexplorer's mainnet metrics, migrated mining rewards (circulating supply) stand at roughly 10.94 billion $PI, of which about 6.19 billion remain locked and 4.75 billion are unlocked. Effective total supply, calculated at 65% of migrated rewards, comes to approximately 16.83 billion $PI, still well below the 100 billion $PI max supply.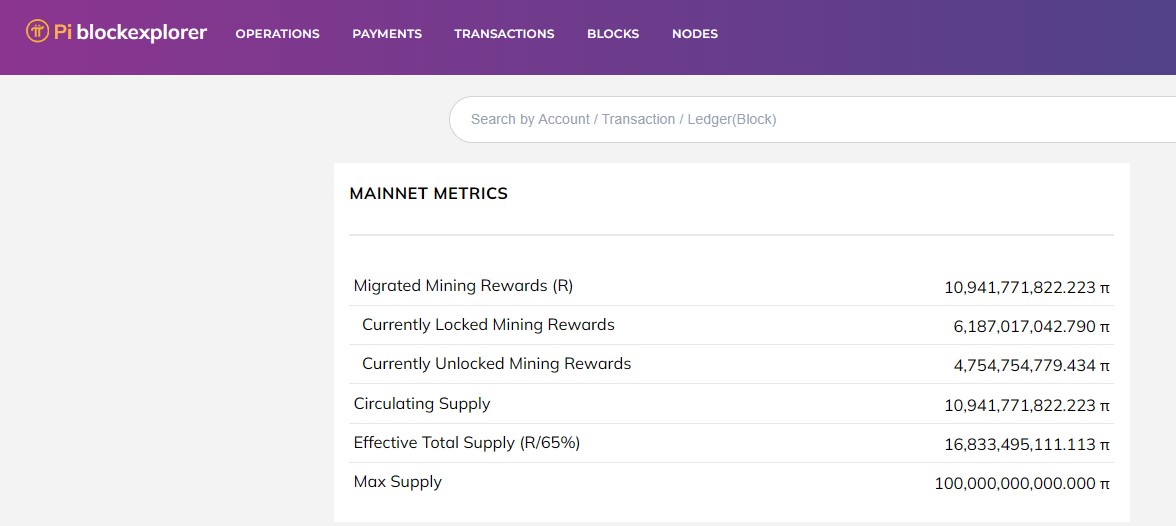
That gap between circulating and max supply is a long-term overhang worth tracking, a theme covered further in the PI Coin 2025-2030 outlook. CertiK rates the project 3.5 out of 5, a middling score that adds a note of caution for anyone weighing whether $PI Network is a good investment in 2026.
Recent Development: $PI Launchpad and SLICE
Per the official Pi Core Team post, $PI Launchpad completed distribution of its second testnet token, SLICE, giving users a look at post-launch liquidity pool mechanics inside the $PI Browser. The Launchpad app now shows individual allocation details, launch and effective token prices, and a live chart tracking SLICE against Test-Pi.
This is a testnet exercise rather than a live event for $PI itself, but it signals the network is pushing forward on infrastructure that could feed into a bullish blockbuster narrative if future token launches gain traction.
Bull, Base, and Bear Scenarios
Bull Case: A reclaim of the $0.08794 EMA followed by a close above $0.10252 opens the door to $0.11883 and $0.13409 on a stronger breakout, a path laid out in more detail in the 2027 technical outlook. Not $1 territory. Probability: 25%.
Base Case: Consolidation between $0.072 and $0.095 while the market digests recent losses, closer to the surprise rally scenario than a clean breakout. Probability: 50%.
Bear Case: A break below $0.07228 support puts the all-time low of $0.07072 back in play, echoing the setup covered in fighting back from record lows. Probability: 25%.
| Timeframe | Bear | Base | Bull |
|---|---|---|---|
| 24H | $0.0780 | $0.0821 | $0.0870 |
| 7D | $0.0720 | $0.0850 | $0.0980 |
| 30D | $0.0650 | $0.0900 | $0.1250 |
| Year-End | $0.0400 | $0.1100 | $0.2500 |
A Pi Network price prediction that reaches $1 would need a dramatic shift in circulating supply dynamics alongside real adoption growth, not just a technical bounce off oversold levels.
Key Risks
A heavy supply overhang from locked mining rewards, a sustained multi-month downtrend, proximity to the all-time low, and a mid-tier CertiK rating all argue for caution, a contrast worth weighing against how $PI stacks up when asked to compete with Pepeto in 2026. Is $PI Network a good investment right now? It depends on risk tolerance; this reads as a token still searching for a floor, not one in accumulation mode.
Disclaimer: This article is for informational purposes only and does not constitute financial advice. Cryptocurrency markets are highly volatile. Always do your own research and consult a licensed financial advisor before making investment decisions.

















