Pump.Fun Price Prediction: Is PUMP About to Shock the Market?


PUMP is having a big day. Up close to 14%, and it's knocking on the door of two boundaries at once.
That's the story behind this pump.fun price prediction right now. Clear both, and there's real room to run higher from here.
Fail, and the price likely settles back down toward recent lows instead.
A lot of short traders just got caught wrong-footed by this move, which tends to add fuel either way once the dust settles.
Live Market Data
PUMP currently sits at $0.002519, up 13.91% over the past 24 hours. Market cap: $995.37 million, also up nearly 14% alongside price. 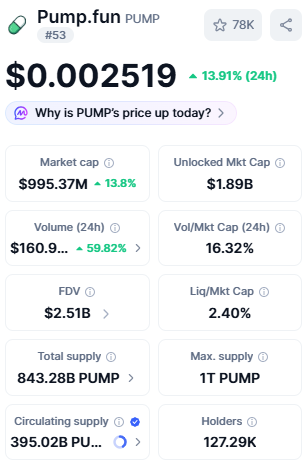
Source: $PUMP Market Cap Data Taken From Coin MarketCap, data as of Aug 05, 2026. Figures may vary slightly across other tracking websites.
Fully diluted valuation runs much higher at $2.51 billion, reflecting the gap between circulating and total supply.
24-hour volume jumped 59.82% to $160.9 million. Circulating supply: 395.02 billion tokens, out of a 1 trillion max.
On-Chain Activity
PUMP now counts over 127,000 holder addresses, a healthy number for a token that's still relatively young.
Combined with today's volume spike, up nearly 60% in 24 hours, that points to fresh interest showing up alongside the price move rather than just a handful of large wallets pushing things around.
Exchange Volume Data of $PUMP
Exchange volume for PUMP is led by two big venues. OKX carries $171.97 million over 24 hours, with Binance close behind at $151.72 million. 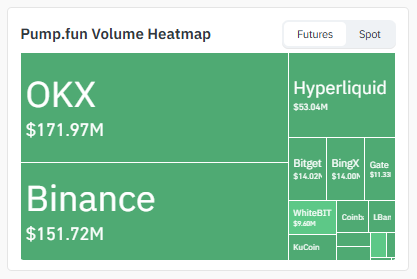
Source: Volume Heatmap Data Taken From Coinglass.
Hyperliquid adds another $53.04 million, and the rest, Bitget, BingX, Gate, and WhiteBIT, split smaller shares.
That kind of concentration on two or three venues means big orders there can shove prices around faster than usual.
Liquidation Data of $PUMP
This is where things get interesting. The liquidation heatmap for PUMP flipped hard toward shorts over the past day; $2.16 million in short positions got wiped out against just $194.83K in longs. 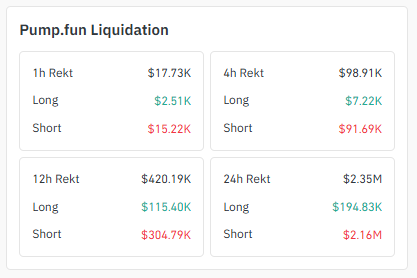
Source: Liquidation Data Taken From Coinglass.
Same story on the 12-hour and 4-hour windows; shorts took the bigger hit both times.
A squeeze like that tends to add its own momentum, since forced short covering shows up as buy pressure on the chart.
Key Takeaways
-
PUMP trades near $0.002519, up nearly 14% on the day, and it's testing the upper boundary of an ascending triangle on the hourly chart.
-
The daily chart shows the same story, price pressing against the top of its own ascending channel.
-
A confirmed breakout puts $0.002648 in range on the hourly chart and stretches toward $0.003403 on the daily.
-
Lose these boundaries instead, and PUMP could fall back to $0.002344, with $0.001368 as the deeper daily target.
-
Shorts, not longs, have taken the brunt of recent liquidations, a sign this move caught a lot of bearish bets off guard.
Hourly Chart: Ascending Triangle
Drop into the 1H chart , and PUMP has carved out an ascending triangle, currently testing its upper boundary too. 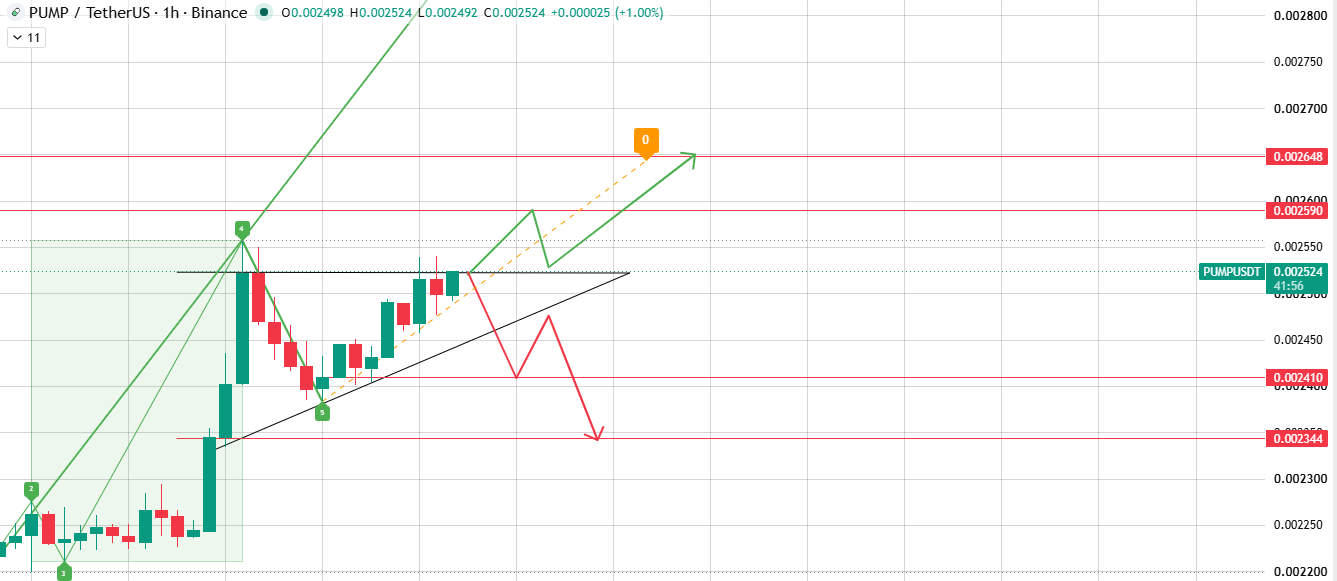
Source: Chart Taken From TradingView.
A Wolfe Wave structure sitting on top of this pattern points to a similar target zone if the breakout confirms.
Break that upper boundary, and $0.002590 shows up first as a resistance level, with $0.002648 as the Wolfe Wave target beyond that.
Break the rising trendline underneath instead, and a bearish breakdown sends PUMP toward $0.002410, then $0.002344 if sellers take control.
Daily Chart: Ascending Channel
Zoom out to the 1D chart, and PUMP has been climbing inside an ascending channel for weeks now. Price is testing the upper boundary.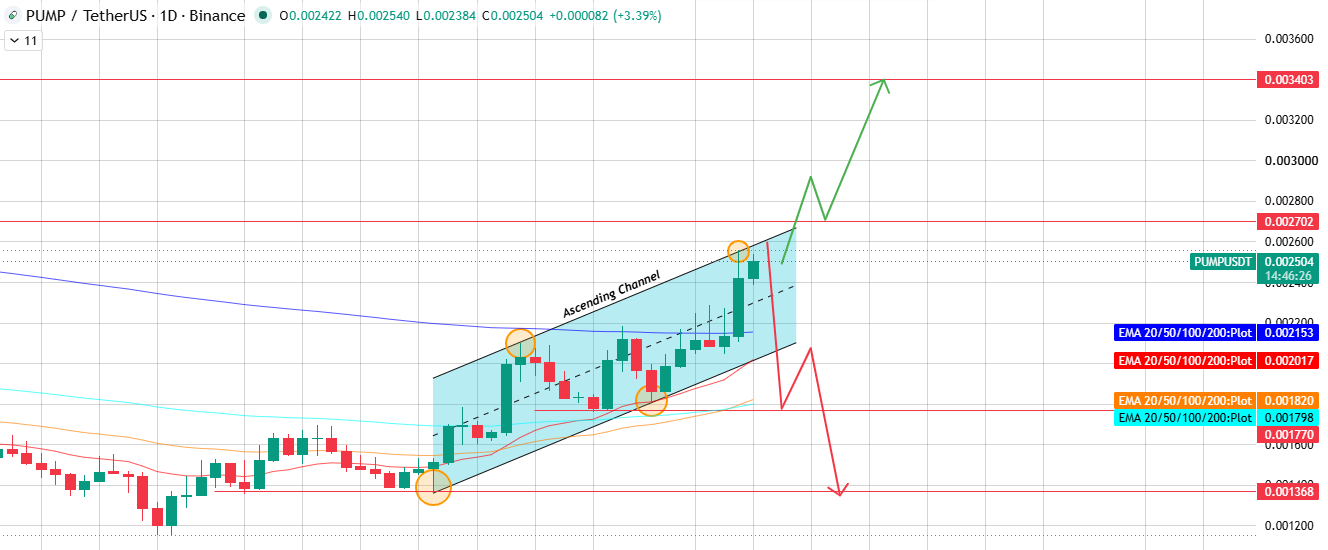
Source: Chart Taken From TradingView.
Clear that boundary, and a bullish breakout puts $0.002702 in play first, with a much bigger stretch target near $0.003403 if buyers keep pushing.
That's a big ask, so it would need sustained volume behind it, not just one strong candle.
Get rejected here instead, and the price likely rolls back through the channel. First support sits around $0.001820, with a deeper floor near $0.001368 if the slide continues.
Bull, Base, and Bear Scenarios
What flips this? The bull case weakens if PUMP can't hold above $0.002410 after a breakout attempt. The bear case weakens if the price reclaims $0.002590 on strong volume.
Social Sentiment of $PUMP
One trader with a sizable following pointed to a broken downtrend and a reclaimed key level as reasons to expect another leg higher for $PUMP, projecting a move somewhere in the 50 to 60 percent range from the current price if support holds. 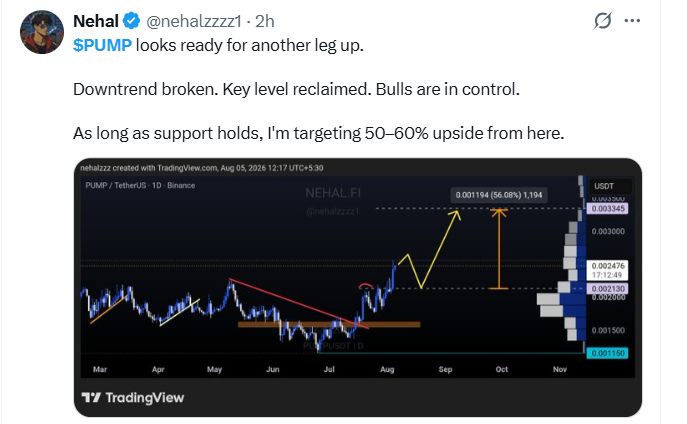
Source: Data Taken From @nehalzzzz1 , X Account.
That's a bold call, and it lines up loosely with the daily chart's own breakout target discussed above, though it's worth treating as one trader's read rather than a certainty.
Market Context
PUMP still trades inside the broader mood of the crypto market, even with its own strong day.
BTC dominance climbing tends to pull capital away from smaller, newer tokens like this one, capping upside even during a clean breakout.
PUMP's ETH correlation through the wider altcoin market matters too, so a rough day for Ethereum could still weigh on this price target conversation regardless of how PUMP's own chart looks.
Glossary
Ascending Triangle: A ceiling that won't move, paired with a floor that keeps creeping up underneath it. Usually breaks upward, but not a sure thing.
Ascending Channel: Price climbing between two parallel lines, both angled up. Works until one of those lines stops holding.
Short Squeeze: Price rises, and traders who bet against it get forced to buy back in just to stop the bleeding. That buying pushes the price up even more.
Liquidation: Margin runs out, the exchange steps in, and the trade gets closed whether the trader wants that or not.
Methodology: This analysis is based on technical chart patterns read from TradingView, along with liquidation and exchange volume data sourced from Coinglass, all as of the time of writing. Price levels are derived directly from the charts referenced, with no extrapolation beyond what the structures show.
Disclaimer: This pump.fun price prediction is for informational purposes only and does not constitute financial advice. Cryptocurrency markets, especially newer tokens like PUMP, are highly volatile and speculative. Always conduct independent research and consider your own risk tolerance before making any investment decisions.


















