Shiba Inu Price Prediction: Is This $SHIB Breakout Real?


$SHIB is currently trading around $0.00000424 at the moment, up about 0.3% on the day, after grinding sideways in a fairly tight band for the past couple of weeks.
Volume isn't exactly roaring either: $42.884 million over the last 24 hours, which is respectable for a meme coin but still light enough that a real move, once it starts, probably won't take its time.
That's really what this Shiba Inu price prediction comes down to: figuring out which way that move breaks. Buyers step in with conviction, and there's a decent runway toward the next resistance zone. Sellers keep the upper hand instead, and SHIB likely revisits support before anything else happens.
Right now, though, it's just coiled up, waiting.
$SHIB Price Today and Market Snapshot
Shiba inu coin value is sitting close to $0.00000424, putting market cap at roughly $2.499 billion against a circulating supply of 589.243 trillion tokens.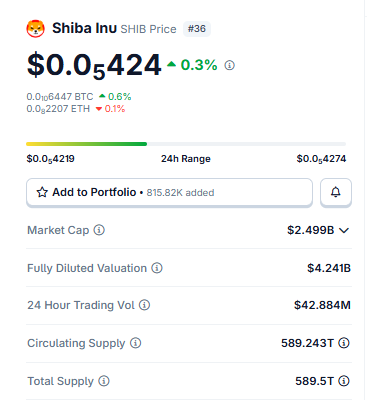
Source: Data Taken From Coingecko.data as of July 23, 2026. Figures may vary slightly across other tracking websites
Fully diluted valuation is noticeably higher, at $4.241 billion, and that gap is basically the difference between what's circulating now and the full 589.5 trillion supply cap.
It's a detail that's easy to skim past but actually matters quite a bit if you're trying to think seriously about where shiba inu coin value could realistically go.
24-hour volume came in at $42.884 million. Worth remembering: with a supply this enormous, even modest percentage swings can represent a fair amount of actual buying or selling pressure underneath the surface.
$SHIB Social Sentiment and News
The biggest item in Shiba Inu news today isn't really about price at all; it's about utility. Purinta, a collateral platform built around meme coins, has confirmed it's launching a dedicated $SHIB market soon.
Source: Data From @TheCryptoBasic, X Account
Once it's live, holders should be able to put their tokens up as collateral and borrow against them, all without actually selling anything.
From what's floating around social channels, the reaction to this shiba inu news has been more measured and practical than hype-driven.
People seem genuinely interested in what a lending market does for shiba inu token holders long-term, rather than treating it as another reason to chase a quick pump.
Shiba Inu Holder Concentration
Here's where things get a little uncomfortable if you're a smaller holder. The top 100 wallets control 83.15% of the total supply.
Zoom in further, and the whale tier, a mere 0.04% of all holders, accounts for a staggering 94.48% of market cap.
The Gini score here sits at 0.9957, which is about as lopsided as these distributions get.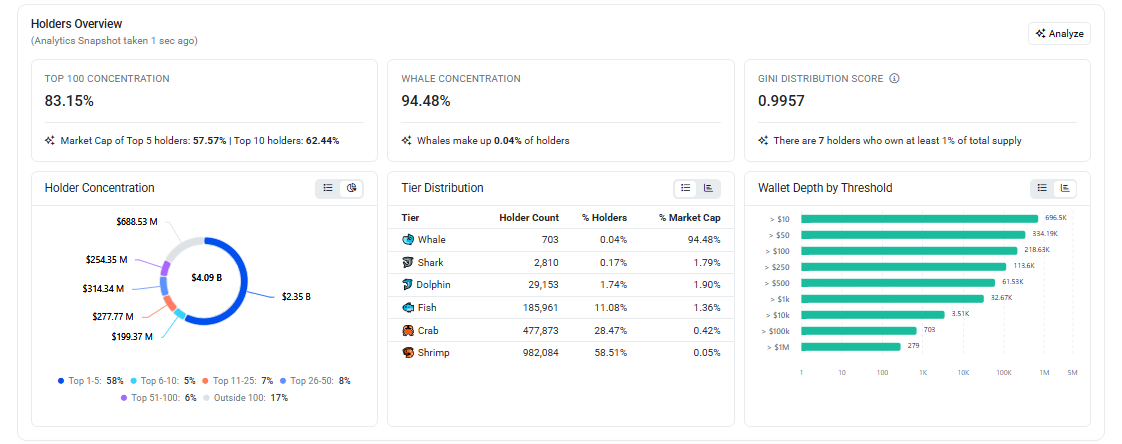
Source: Holder Data Taken From Etherscan
Break it down even more and the top 1-5 wallets alone hold 58% of everything, followed by 5% for wallets ranked 6-10, 7% for 11-25, 8% for 26-50, and 6% for 51-100. Whatever's left over, 17%, gets split among everyone outside the top 100.
Wallet depth numbers tell the same story from a different angle: 696.5K wallets hold more than $10 worth of $SHIB, but only 279 wallets on the entire network hold above $1 million.
That gap alone is enough to confirm that shiba inu whales accumulate tokens methodically, and when a handful of addresses control that much of the supply, their decisions carry a lot more weight than any wave of retail buying ever could.
None of this is a reason to panic. Concentration like this is common across meme coins, but it's a legitimate risk factor worth keeping in mind before sizing up a position.
How SHIB Stacks Up Against Other Meme-Coin Majors
| Token | 24H Change | Setup |
|---|---|---|
| Shiba Inu (SHIB) | +0.3% | Ascending channel (4H) + falling trendline test (1D) |
| Similar Large-Cap Meme Tokens | Mixed | Range-bound near key support |
| Mid-Cap Meme Tokens | Mixed | Consolidating below prior highs |
Shiba Inu 4H Chart: An Ascending Channel Getting Squeezed
Switch over to the 4-hour chart, and SHIB has been climbing steadily inside a fairly clean ascending channel, higher lows stacking on higher lows, and higher highs following suit.
Price has now worked its way up near the top edge of that channel.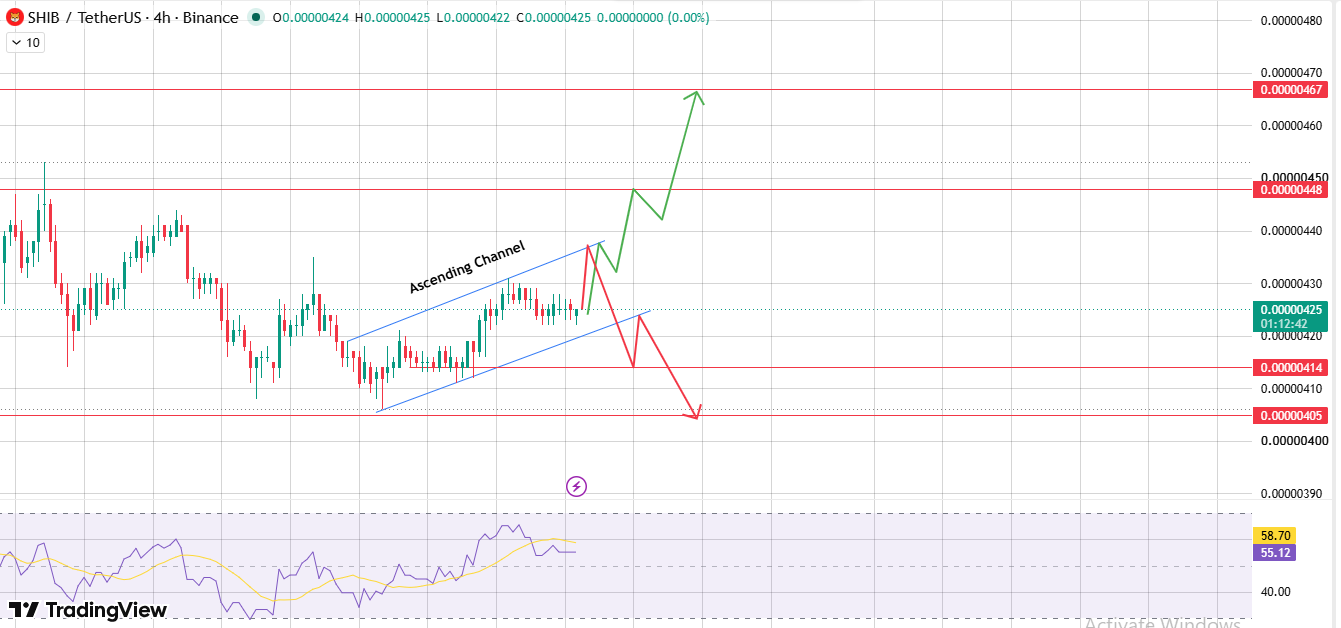
Source: Chart Taken From TradingView at 23-07-2026
Break through the upper boundary, and the next target zone runs from roughly $0.00000448 up to $0.00000467.
Slip out the bottom instead, and $0.00000414 becomes the first thing to watch, with $0.00000405 sitting underneath as a deeper support level if that doesn't hold either.
Momentum on this timeframe hasn't fully committed one way or the other; it's sitting in that neutral-to-slightly-bullish territory that usually shows up right before a channel finally makes up its mind.
Shiba Inu 1D Chart: A Falling Trendline And A Wolfe Wave In Play
Pull back to the daily chart , and a different, longer-running structure comes into view: a falling trendline that's been quietly pressing price down for weeks, and it's running right through the exact zone SHIB is testing today.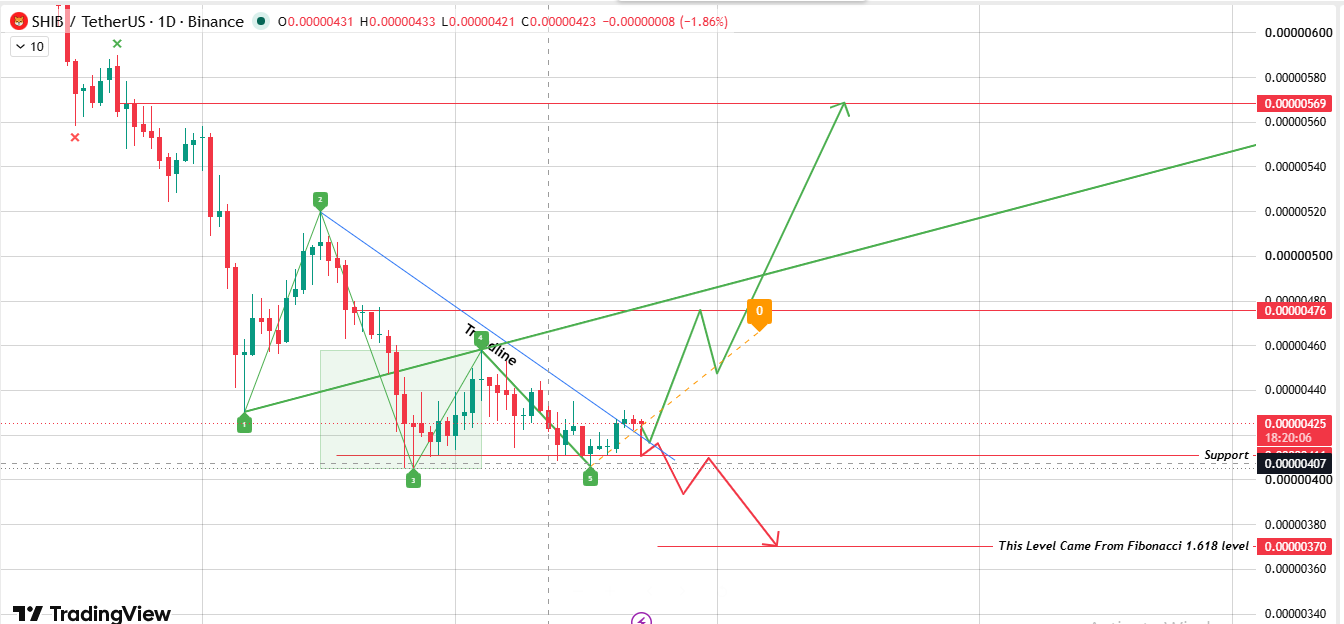
Source: Chart Taken From TradingView at 23-07-2026
Sitting on top of that trendline is something that looks a lot like a Wolfe Wave, a five-point pattern (usually labeled 1 through 5 on the chart) that traders lean on to project where price is likely headed once the structure finally resolves.
If that falling trendline gives way and the price closes above it, the near-term target lands around $0.00000476, with a more optimistic Fibonacci extension stretching toward $0.00000569 if buyers really commit.
If the trendline holds its ground instead and pushes price back down, $0.00000407 is the support level that matters most.
Lose that, and the Fibonacci 1.618 extension puts a downside target near $0.00000370 in play.
Shiba Inu Price Prediction: Bull, Base, And Bear Scenarios
| Scenario | Trigger | Near-Term Target | Extended Target |
|---|---|---|---|
| Bull | The 1D trendline breaks upward; the 4H channel confirms with strong volume. | $0.00000448 | $0.00000467 $0.00000476 $0.00000569 |
| Base | Price stays boxed inside the 4H channel. | Range-bound chop | Momentum stays neutral until a clear breakout or breakdown occurs. |
| Bear | The 1D trendline holds as resistance; the 4H channel support fails. | $0.00000414 $0.00000405 | $0.00000407 $0.00000370 |
Any Shiba Inu price prediction that only talks up the bullish Wolfe Wave target while glossing over the trendline-rejection scenario is only telling you half the story.
Both patterns are flagging that a real move is coming; the direction just hasn't been decided yet.
Will Shiba Inu Go Up? A Straightforward Take
So, bottom line, where does that leave things? SHIB happens to be sitting at a real decision point on both the 4-hour and daily charts simultaneously, and that kind of overlap doesn't come around often.
The ascending channel on the shorter timeframe and the falling trendline on the daily are both being tested right now, at more or less the same time.
If support holds up on both fronts, the Wolfe Wave projections point toward meaningfully higher ground the $0.00000448 to $0.00000467 zone in the near term, and potentially $0.00000476 to $0.00000569 further out if the daily structure breaks the right way.
Like most meme coins with this kind of market cap, SHIB doesn't move entirely on its own.
Bitcoin dominance shifts and broader risk appetite across altcoins tend to dictate how much room a token like this actually gets once a pattern resolves.
Calm BTC price action generally means SHIB's setup plays out closer to what the charts suggest.
A volatile BTC, on the other hand, usually means SHIB's channel and trendline resolve faster and messier than the clean lines on the chart would have you believe.
Then there's the question that never seems to go away: will the Shiba Inu coin reach $1?
Honestly, the math just doesn't work. Circulating supply is sitting above 589 trillion tokens, and a $1 SHIB would mean a market cap bigger than every other asset class on the planet put together.
That's not pessimism; it's arithmetic. For that to even become theoretically possible, supply would need to shrink by several orders of magnitude through sustained, aggressive burning.
A shiba inu burn rate increase does occasionally lift sentiment for a day or two, but at the current scale, burns simply aren't large enough relative to total supply to move the needle by themselves.
A more realistic lens for shiba inu coin value going forward is the technical picture laid out above: small, fraction-of-a-cent moves tied to actual chart structure, rather than $1 fantasies built on hope.
Whether this shiba inu crypto setup ultimately breaks bullish comes down to whether buyers show up and defend both the channel and the trendline over the next handful of sessions, not to any single Purinta-style headline or Wolfe Wave marking taken in isolation.
And if Shiba Inu history has taught us anything, it's that the moves that actually stick have always come with real volume behind them, not just social media noise.
Quick Glossary
An ascending channel is a rising price structure boxed in by parallel support and resistance lines, generally read as bullish as long as price keeps respecting both edges.
A Wolfe Wave pattern is a five-point structure traders use to project a target based on the symmetry of prior price swings. It's less about how it looks and more about where those swings are hinting the price wants to go next.
A falling trendline is a downward-sloping line drawn across a series of lower highs, used to gauge whether sellers are still capping every attempted bounce.
Fibonacci extensions are levels projected beyond a completed price swing, commonly used to estimate how far a move might travel once a pattern actually breaks.
A Quick Note On How This Was Put Together
Every level mentioned here channel boundaries, trendline zones, and Wolfe Wave targets was pulled straight from the 1D and 4H charts reviewed while writing this.
Nothing here was stretched or guessed beyond what the charts themselves show.
Holder concentration figures come from a snapshot analytics pull rather than a constantly live feed, and price, market cap, and supply numbers reflect a snapshot taken at the time of writing, so a few of these figures may have shifted slightly by the time you're reading this.
Always double-check a live chart before acting on anything above.
Disclaimer: This article is for informational purposes only and is not financial advice. Cryptocurrency markets are volatile; do your own research before investing.
Also read:

















