Shiba Inu Price Prediction: Can SHIB Break Out Before the Next Rally?

This Shiba Inu price prediction lands at an interesting moment. $SHIB is quietly setting up a move that could go either way, and the charts are giving some pretty clear clues about which direction wins.
Right now Shiba Inu sits at $0.000004271, up a modest 2.1% over the last 24 hours, with the token bouncing between $0.000004116 and $0.000004277 in that window.
Market cap holds at $2.517B, and the setup on the charts is worth watching closely over the next few sessions.
How $SHIB Compares
| Metric | Shiba Inu (SHIB) | Typical Large-Cap Meme Coin |
|---|---|---|
| Market Cap | $2.517B | Varies widely |
| Mcap/FDV Ratio | 0.59 | Often 0.7–0.9 |
| Whale Concentration | 94.48% | Typically lower for older tokens |
| 24h Volume | $55.415M | Comparable range |
Source: According to CoinGecko
Liquidation Data: Shorts Are the Ones Getting Squeezed
As per the Coinglass liquidation heatmap, it tells its own little story right now. Over the past hour and 4 hours, it's entirely short positions getting wiped out at $1.67 each, small numbers, but the direction matters.
Zoom out to 12 hours, and it's $669.68 in shorts liquidated with zero longs touched.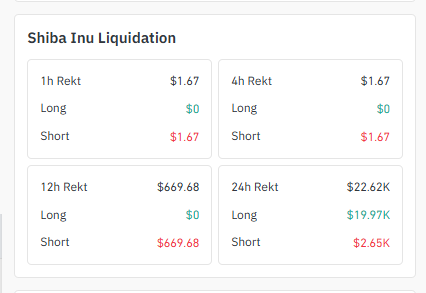
The 24-hour picture flips things a bit: $22.62K total liquidated, with longs actually taking the bigger hit at $19.97K versus $2.65K in shorts.
Read that as some over-leveraged longs got caught in an earlier dip, but the most recent momentum has been punishing short-sellers.
Which loosely supports the idea that this trendline break has some real buying behind it, at least for now.
Exchange Volume Heatmap
Trading activity remains heavily concentrated. LBank leads with $16.45M in futures volume, followed by OKX at $9.83M.
On the sell-heavy side, MEXC shows $3.89M and Bitget $2.98M, while Bitunix, Gate, WhiteBIT, Kraken, KuCoin, and CoinEx round out smaller pockets of liquidity. 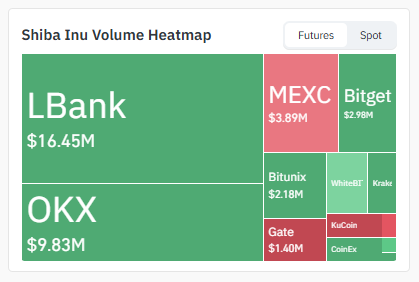
Source: Volume Heatmap Data From Coinglass
This kind of lopsided exchange volume distribution across mid-tier exchanges means SHIB's short-term moves can get exaggerated pretty easily; thin books amplify both breakouts and fakeouts.
Social Sentiment: Burn Rate Heats Up
On the sentiment side, @TheCryptroBasic, burn activity has picked up noticeably.
Reports circulating show 13.2 million SHIB destroyed in a single day across 13 separate transactions, with the largest burn of 9.7 million tokens sent to a dead wallet from a CEX. 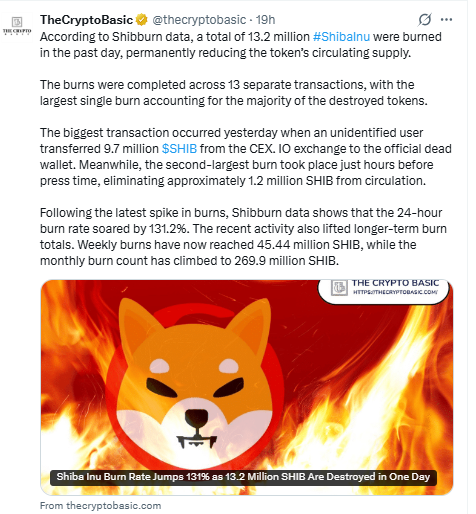
Source: Data Taken From X
That pushed the 24-hour token burn rate up 131.2%, with weekly burns now at 45.44 million SHIB and the monthly count near 269.9 million.
Burns of this size don't move the needle much against a 589 trillion supply, but the narrative tends to give sentiment a short-term lift, and traders have clearly noticed.
Whale Concentration: A Number Worth Watching
Away from the charts, Shiba Inu holder data is a little eye-opening.
Just 703 wallets classified as "whales" control 94.48% of the market cap, and the top 100 addresses alone hold 83.18% of supply. 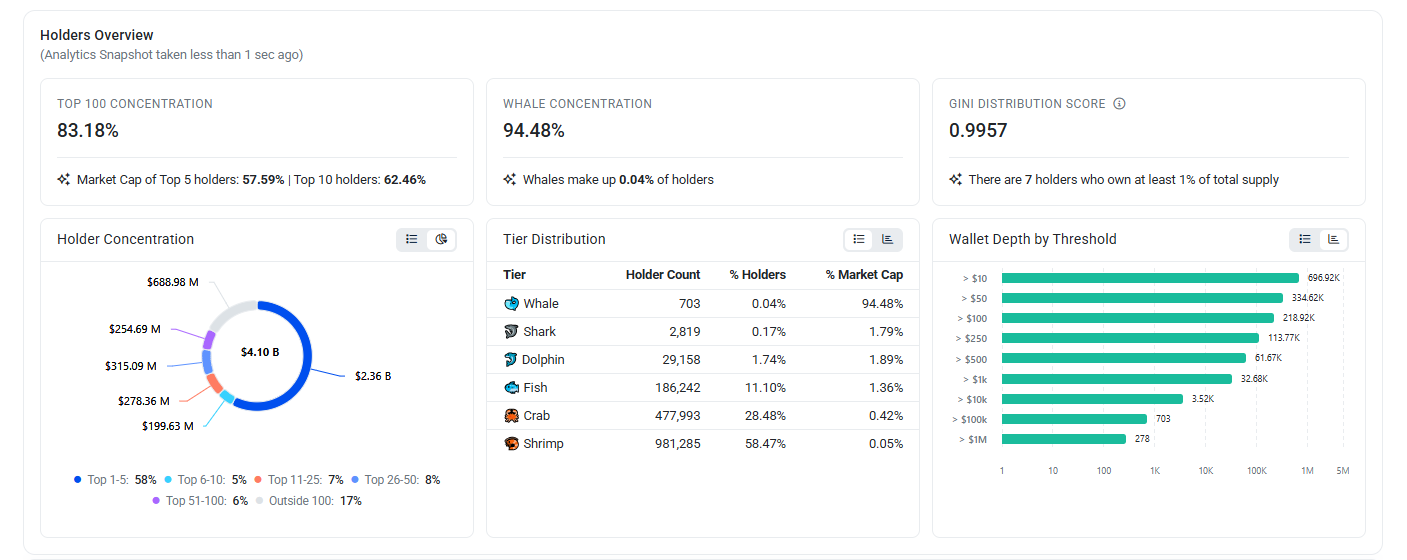
The Gini distribution score sits at 0.9957, about as concentrated as it gets. With whale concentration this extreme, a handful of large wallets moving in or out can swing price far more than retail activity ever could.
It's a factor worth keeping in the back of your mind on any breakout attempt.
Shiba Inu 4H Chart: The Trendline Just Broke. Now what?
Pull up the 4-hour timeframe and the story is pretty clear. Price had been respecting a descending trendline for the better part of the recent session;
Every bounce got sold into, and every rally got capped right at that sloping line. Classic lower-highs behavior.
That's changed. Candles have pushed through the trendline, and the price is now sitting right above it. 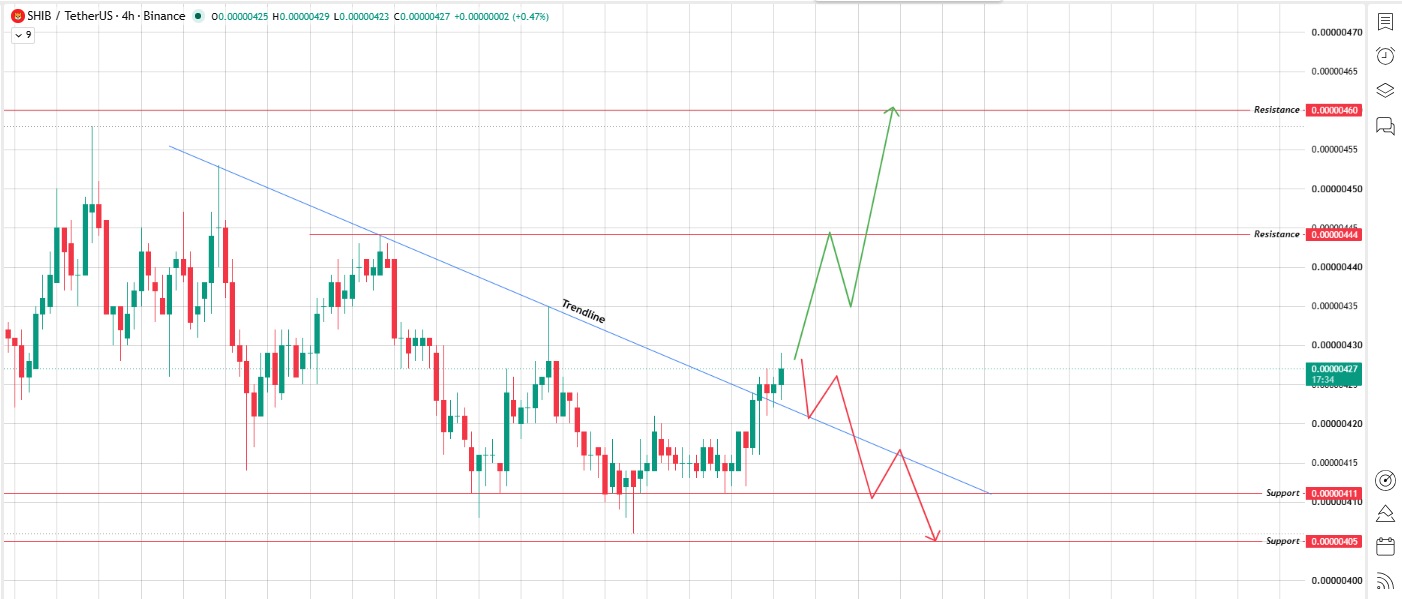
Source: Chart Taken From TradingView.
Here's where it gets interesting, though: there are genuinely two ways this plays out from here.
If this breakout comes with real conviction, meaning exchange volume actually steps up and buyers keep defending the breakout zone.
The next stop is the resistance level at $0.00000444, and a clean push through that opens up $0.00000460 fairly quickly.
But if this turns out to be nothing more than a liquidity sweep price poking above the trendline just to grab stop-losses before reversing, then the support zone at $0.00000411 comes into play first, and a breakdown there exposes $0.00000405.
Watch the next few 4H candles closely. A trendline breakout that can't hold above the line within a candle or two usually turns into exactly that kind of trap.
Shiba Inu 1D Chart: Boxed In, Waiting for a Trigger
Zoom out to daily, and $SHIB has basically been carving out a rectangle for over a week now, a textbook sideways consolidation.
Price has repeatedly tested a resistance level near $0.00000446 (that red zone at the top of the box) and keeps getting rejected from it, while the $0.00000405 support zone underneath has held firm every single time it's been tested.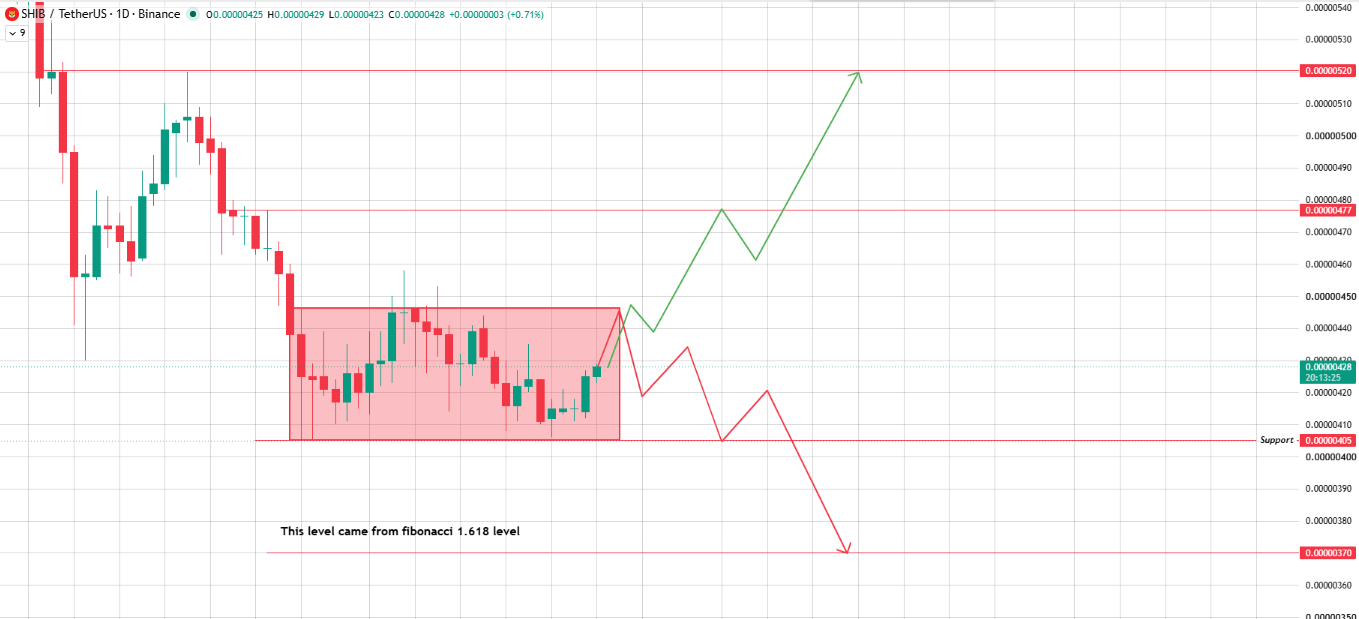
This is the level that actually decides SHIB's next real trend, not the 4H trendline break.
If daily candles manage to close above $0.00000446 with follow-through, that's a genuine bullish breakout out of the range, and it lines up with the same $0.00000477 target and stretches toward $0.00000520 further out.
If SHIB fails at $0.00000446 again and it's failed here more than once already, the range likely resolves lower.
A bearish breakdown below $0.00000405 has a downside price target near $0.00000370, a level that lines up with a 1.618 Fibonacci extension drawn off the prior swing.
Worth noting: that $0.00000370 target is a technical projection, not a guarantee.
It's simply where math says the move could extend if sellers take full control.
Three-Scenario Outlook
| Scenario | Trigger | Target Zone |
|---|---|---|
| Bull Case | Daily close above $0.00000446 with rising exchange volume | $0.00000477 $0.00000520 |
| Base Case | Price stays range-bound between $0.00000405–$0.00000446 | Choppy, no clear trend |
| Bear Case | Breakdown below $0.00000405 support zone | $0.00000370 |
Glossary
Descending trendline: Basically a slanted line connecting a series of lower highs. Price keeps bumping into it and getting pushed back down until one day it doesn't.
Liquidation heatmap: Shows where leveraged traders get forced out of their positions, either longs or shorts, once price hits certain levels.
Fibonacci extension: A charting tool traders use to guess how far a move might travel once it clears a prior high or low. Not magic, just probability.
Whale concentration: How much of a token's supply sits in a small number of big wallets. Higher number, more room for one or two players to swing the price.
Final Outlook
SHIB is at a genuine decision point. The 4H descending trendline break gives short-term bulls something to work with, but it needs exchange volume to confirm it's real rather than a liquidity sweep.
The bigger trigger, though, is the daily $0.00000446 resistance level; clear that with conviction, $0.00000477–$0.00000520 comes into view.
Fail there again, and $0.0₅405 support, then $0.00000370, are the levels that matter. Broader crypto conditions, including BTC dominance trends and ETH correlation, will likely still set the tone for how far either move can travel.
Methodology
Price levels and chart patterns referenced in this article are drawn directly from TradingView 1D and 4H SHIB/USDT charts on Binance.
Liquidation, exchange volume, and holder concentration data reflect real-time analytics snapshots at the time of writing.
Disclaimer: This Article is for informational and educational purposes only and should not be considered financial, investment, or trading advice. Cryptocurrency markets are highly volatile, and prices can change rapidly. Always do your own research and consult a qualified financial advisor before making any investment decisions. Past performance does not guarantee future results.
Also read:

















