XRP Price Prediction July 2026: Key Support Levels, RLUSD and MiCA

The XRP Price Prediction July 2026 outlook is focused on a critical battle around the $1.06 support zone. XRP is changing hands near $1.05, up around 0.61% today, but the broader trend remains under pressure after the token dropped from a recent high near $1.34. The key question now is whether buyers can defend support and trigger a recovery or whether XRP will fall toward $0.80 and potentially lower.
The current setup is mixed. A deeply oversold weekly RSI and a Tom DeMark Sequential buy signal suggest a possible short-term bounce. However, XRP remains below major weekly EMAs, trading volume has weakened, and recent liquidation data shows leveraged bulls are still facing pressure.
For anyone researching XRP price prediction 2026, the most important factors are the $1.06 support level, XRP moving averages, Fibonacci retracement levels, derivatives positioning, ETF flows, whale activity, and Ripple's growing stablecoin ecosystem.
What Is the XRP Price Today?
XRP trades around $1.0497, up approximately 0.61% on the day.
Futures volume over the past 24 hours stands near $1.64 billion, down 13.81% from the previous day. Spot trading volume is much lower at around $345.76 million.
Open interest has declined 1.80% to approximately $2.30 billion, suggesting some leveraged positions are being closed.
Options volume has also fallen 31.68% to around $1.96 million, although options open interest increased 2.28% to approximately $22.91 million.
XRP's market cap is near $65.30 billion, with approximately 62.24 billion tokens circulating out of a maximum supply of 100 billion.
The decline in derivatives activity is important for the current XRP forecast 2026 because a stronger recovery generally needs improving spot demand and trading volume, not just leveraged bets.
Is XRP Flashing a Buy Signal in July 2026?
The daily chart has produced a potential short-term bullish signal through the Tom DeMark Sequential indicator.
This setup can sometimes appear before a short bounce lasting one to four candles. However, it should not be treated as confirmation of a major trend reversal.
The weekly RSI offers another reason for bulls to remain interested. At 28.88, the indicator is in oversold territory, suggesting that selling pressure may have become stretched.
The broader trend, however, remains weak.
$XRP is currently below all four major weekly EMAs:
-
20-week EMA: $1.3598
-
50-week EMA: $1.6739
-
100-week EMA: $1.6725
-
200-week EMA: $1.3860
This creates a significant resistance wall above the current price.
Therefore, the analysis today is divided between short-term reversal potential and a longer-term bearish trend. The RSI and DeMark indicator support a relief bounce, while the moving averages continue to signal caution.
What Are the Key $XRP Support and Resistance Levels?
The $1.06 level is currently the most important support zone.
The weekly candle opened near $1.0485, moved to $1.0768, dropped to approximately $1.0220, and then recovered toward $1.05.
On-chain URPD data identifies the $1.06 region as an important support floor. It is also close to the 0.786 Fibonacci retracement at $1.0124, measured from XRP's cycle high near $3.65.
If it holds $1.06 on a daily closing basis, the first recovery targets are:
-
$1.27: Initial upside target
-
$1.35: Resistance near the 20-week EMA
-
$1.58: Major Fibonacci and moving-average resistance
A successful move above $1.35 could improve the XRP price target 2026 outlook and bring $1.58 into focus.
On the downside, a clean break below $1.06 could expose it to $0.80, followed by $0.62 and potentially $0.51.
For traders monitoring XRP support and resistance levels, $1.06 is therefore the immediate pivot. Holding it keeps the recovery scenario alive, while losing it would strengthen the bearish case.
What Do $XRP Moving Averages and Fibonacci Levels Show?
XRP's long-term moving averages remain a major obstacle for bulls.
On the monthly chart, The trading between the 77 EMA and 111 EMA. The 77 EMA is near $0.85, while the 111 EMA is around $1.65.
The current price is above the lower long-term average but remains below the higher resistance zone.
The Fibonacci structure adds further context. The $1.0124 level represents the 0.786 retracement, while the $1.58 region is linked to the 0.618 retracement.
The technical model behind this outlook combines RSI, EMA positioning, Fibonacci levels, trading volume, and momentum. MVRV can also be used as a valuation indicator, although the source data available for this update does not provide a current MVRV reading.
The model currently shows:
-
RSI: Potentially bullish due to oversold conditions
-
EMA: Bearish because it remains below major averages
-
Fibonacci: $1.01–$1.06 is a key support area
-
Trading volume: Weakening
-
MVRV: No current figure available for confirmation
This combination suggests XRP is not yet showing a fully confirmed trend reversal.
Are $XRP Whales Buying or Selling?
XRP network activity has increased, but the data does not clearly confirm whale accumulation.
Daily active addresses jumped almost 50% in two weeks, rising from approximately 23,000 to nearly 40,000.
This increase suggests greater network participation, but new activity does not always translate into new buying.
The available analysis indicates that some large holders have been moving toward exchanges, potentially suggesting distribution rather than accumulation.
Liquidation data also shows that leveraged bulls have suffered more recently.
During the previous 24 hours:
-
Long liquidations: $3.33 million
-
Short liquidations: $730,000
Over 12 hours:
-
Long liquidations: $1.52 million
-
Short liquidations: $534,780
Over four hours:
-
Long liquidations: $1.45 million
-
Short liquidations: $434,790
The most recent one-hour period showed the opposite trend, with shorts losing approximately $331,450 versus only $6,320 for longs.
Exchange positioning is also mixed. Binance's XRP/USDT long-short account ratio is approximately 2.61, while OKX is near 2.62. However, the broader 24-hour ratio is around 0.9701, showing that aggregate positioning is almost balanced.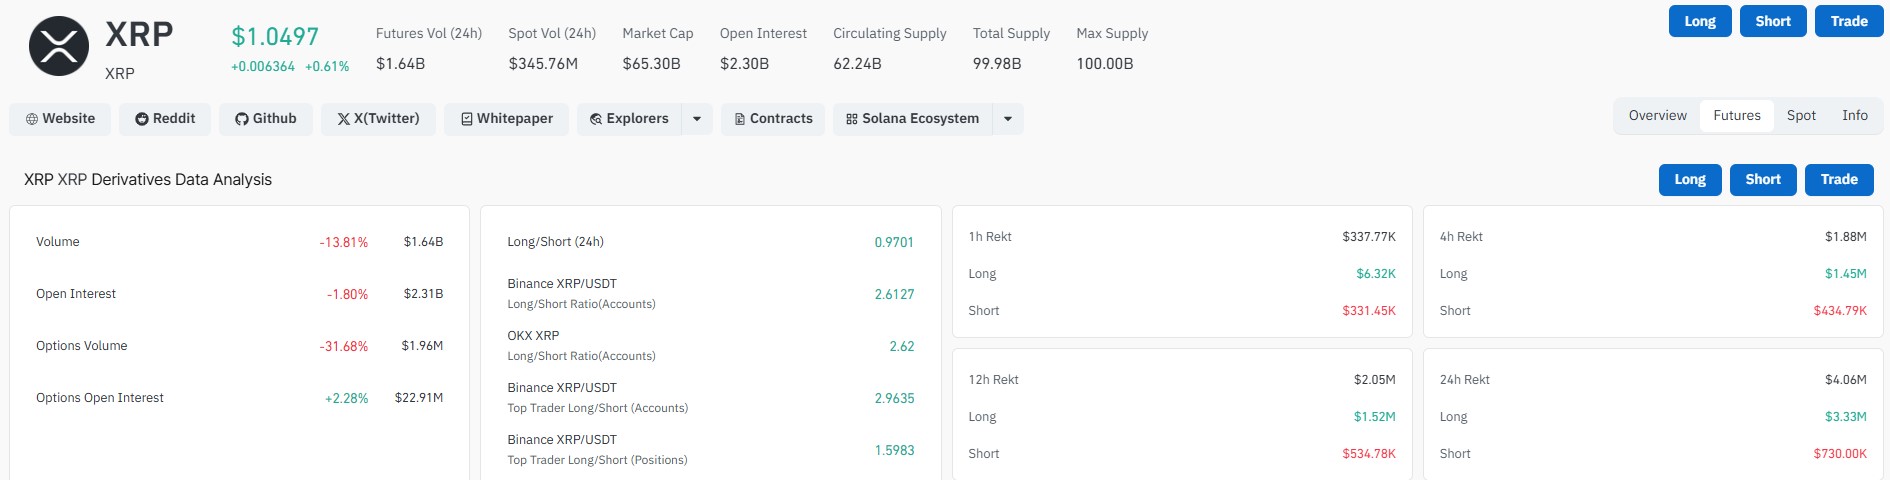
How Do RLUSD and MiCA Affect $XRP?
Ripple's RLUSD stablecoin has recently undergone a major supply adjustment.
Around 146 million RLUSD tokens were burned, reducing its market capitalization from approximately $1.9 billion to $1.4 billion.
Following this change, Ethereum reportedly surpassed the XRP Ledger in terms of RLUSD supply held on the network.
The timing also coincides with Europe's MiCA regulatory framework and its requirements for stablecoin issuers.
A new stablecoin called Open USD, or OUSD, is also entering the market, reportedly involving participants including Ripple, BlackRock, and Google.
These developments do not directly determine price. However, they are relevant to institutional adoption and Ripple's wider financial infrastructure strategy.
If Ripple's stablecoin ecosystem expands successfully, it could strengthen the broader network narrative, although that does not automatically create direct demand for $XRP.
Are $XRP ETFs Seeing Inflows or Outflows?
As of June 30, XRP ETFs recorded approximately $2.83 million in net outflows.
The figure is relatively small compared with overall market size, but continued outflows could signal weaker institutional demand.
This is important when discussing the ETF approval impact. ETF approval can improve market access, but actual price influence depends on sustained net inflows.
Traders should therefore watch weekly ETF flows alongside spot volume, whale activity, and open interest.
$XRP Price Prediction 2026: Bull, Base and Bear Scenarios
| Scenario | 2026 Target | Probability | Main Assumption | Invalidation |
|---|---|---|---|---|
| Bull Case | $2.20–$3.50 | 25% | It reclaims $1.58 with stronger institutional demand | Sustained break below $0.80 |
| Base Case | $1.27–$2.20 | 50% | $1.06 holds and gradually recovers | Daily close below $1.00 |
| Bear Case | $0.51–$0.80 | 25% | $1.06 fails amid broader crypto weakness | Strong recovery above $1.35 |
These are probability-based scenarios rather than guaranteed targets.
$XRP Monthly Price Prediction 2026
| Month | Low | Average | High |
|---|---|---|---|
| January | $1.20 | $1.45 | $1.70 |
| February | $1.10 | $1.35 | $1.65 |
| March | $1.00 | $1.25 | $1.55 |
| April | $0.95 | $1.20 | $1.50 |
| May | $0.90 | $1.15 | $1.40 |
| June | $0.85 | $1.10 | $1.35 |
| July | $0.80 | $1.15 | $1.35 |
| August | $0.90 | $1.30 | $1.60 |
| September | $1.00 | $1.45 | $1.90 |
| October | $1.10 | $1.60 | $2.20 |
| November | $1.25 | $1.85 | $2.60 |
| December | $1.40 | $2.10 | $3.20 |
These estimates represent potential scenarios and should not be interpreted as guaranteed monthly prices.
How Does $XRP Compare With Other Price Forecasts?
Several major forecasts provide a wide range of potential outcomes.
Standard Chartered has previously been associated with a base-case target around $2.80.
EGRAG Crypto has discussed longer-term cycle projections in the broad $7–$10 range.
21Shares has presented a scenario framework around $2.45 base, $2.69 bull, and $1.60 bear cases.
These forecasts use different methodologies and timeframes, so they should not be treated as directly comparable.
The broader takeaway is that analysts remain divided between a gradual recovery scenario and a much larger long-term cycle expansion.
Was the Previous $XRP Prediction Right?
The previous outlook focused on the $1.06 support level and suggested that holding the zone could open a recovery toward $1.27 and $1.35, while losing it could expose $XRP to $0.80 or lower.
With currently trading near $1.05, the prediction remains unresolved.
The support zone has been tested, but there has not yet been a decisive breakdown toward $0.80 or a confirmed recovery above $1.35.
Therefore, the previous prediction can be considered partially confirmed but still active.
The next update should focus on whether it can reclaim $1.27 and $1.35 or instead close below $1.00.
$XRP Bull Case vs Bear Case: What Happens Next?
The bull case requires it to defend $1.06, recover above $1.27 and $1.35, and eventually challenge $1.58. Rising spot trading volume, positive ETF flows, and stronger institutional demand would further support the bullish outlook.
The bear case becomes stronger if it loses $1.06 and closes below $1.00. In that situation, $0.80 becomes the first major downside target, followed by $0.62 and $0.51.
For traders asking how high can it go, the 2026 outlook could range from a recovery toward $2.20–$3.50 under the bull case to much lower levels if support fails.
Questions such as will it reach $5 or will it reach $10 require a much stronger market cycle, sustained institutional adoption, and a significantly higher XRP market cap potential.
Similarly, an XRP price prediction 2030 would require a separate long-term model based on adoption, regulation, liquidity, market cycles, and Ripple's role in global payments.
Is $XRP a Good Long-Term Investment?
Whether XRP is a good long-term investment depends on an investor's risk tolerance and time horizon.
The positive case includes rising wallet activity, Ripple's expanding stablecoin ecosystem, potential institutional adoption, and the possibility of stronger ETF demand.
The negative case includes weak moving-average structure, recent ETF outflows, declining derivatives activity, and evidence of leveraged long liquidations.
For now, the most important levels remain $1.06 for support and $1.35–$1.58 for resistance.
The short-term price prediction today remains cautious, while the price prediction this week depends heavily on whether buyers can defend the current support area.
Whether XRP is a good long-term investment ultimately depends on whether the network's adoption and institutional use cases translate into sustained demand over time.
Final $XRP Price Prediction July 2026 Outlook
The XRP Price Prediction July 2026 remains balanced between a potential short-term bounce and a broader bearish trend.
The $1.06 zone is the immediate battleground. Holding this level could allow it to test $1.27 and $1.35, while a stronger breakout could bring $1.58 into focus.
On the other hand, losing $1.06 and then $1.00 could expose $XRP to $0.80, $0.62, or even $0.51.
The oversold RSI and Tom DeMark buy signal give bulls a reason for optimism, but the major weekly EMAs, weak trading volume, ETF outflows, and uncertain whale activity prevent a confirmed trend reversal.
For investors following XRP price prediction 2026, the next major confirmation should come from the combination of price action, volume, ETF flows, and moving-average recovery rather than a single technical indicator.
Disclaimer
This article is for informational purposes only and does not constitute financial, investment, or trading advice. Cryptocurrency prices are highly volatile and can move sharply in either direction without warning. Past performance and chart-based projections do not guarantee future results. Always conduct your own research and consult a licensed financial advisor before making any investment decisions.










.webp)











